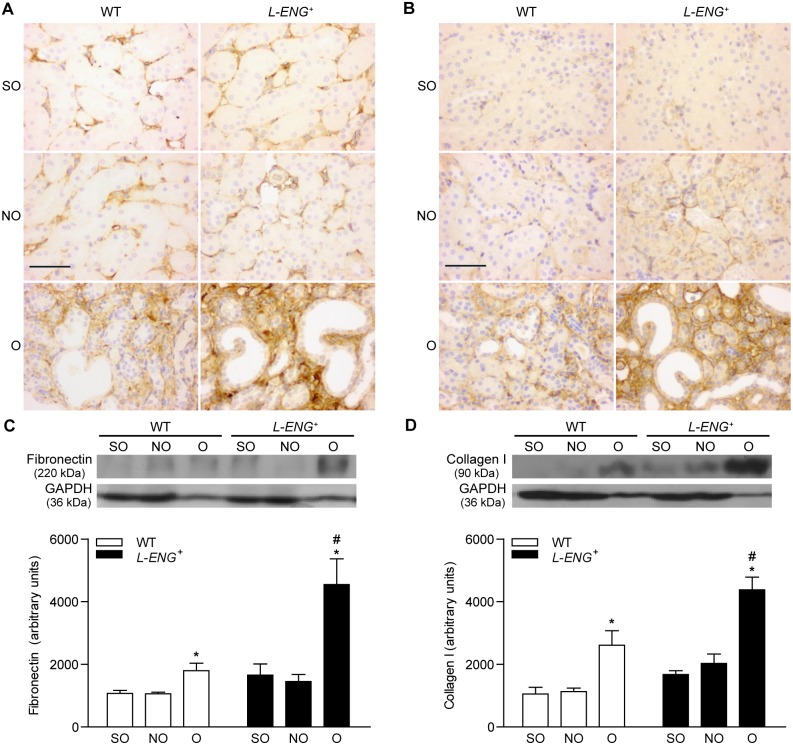
Figure 4. Effect of L-Endoglin overexpression on fibronectin and collagen I expression following ureteral obstruction.
Representative immunohistochemistry images for fibronectin (a) and collagen I (b) in sham operated (SO), non-obstructed (NO) and obstructed (O) kidneys from WT and L-ENG + mice. Bar = 100 µm. Western blot analysis of fibronectin (c) and collagen I (d) protein amount in SO, NO and O kidneys from WT and L-ENG+ mice. A representative western blot among 5–7 performed in each group is shown on top. Densitometry analysis is represented as the mean ± SEM of the 5–7 western performed per group. *P<0.01 vs. SO kidneys. #P<0.05 vs. O kidneys from WT mice.

