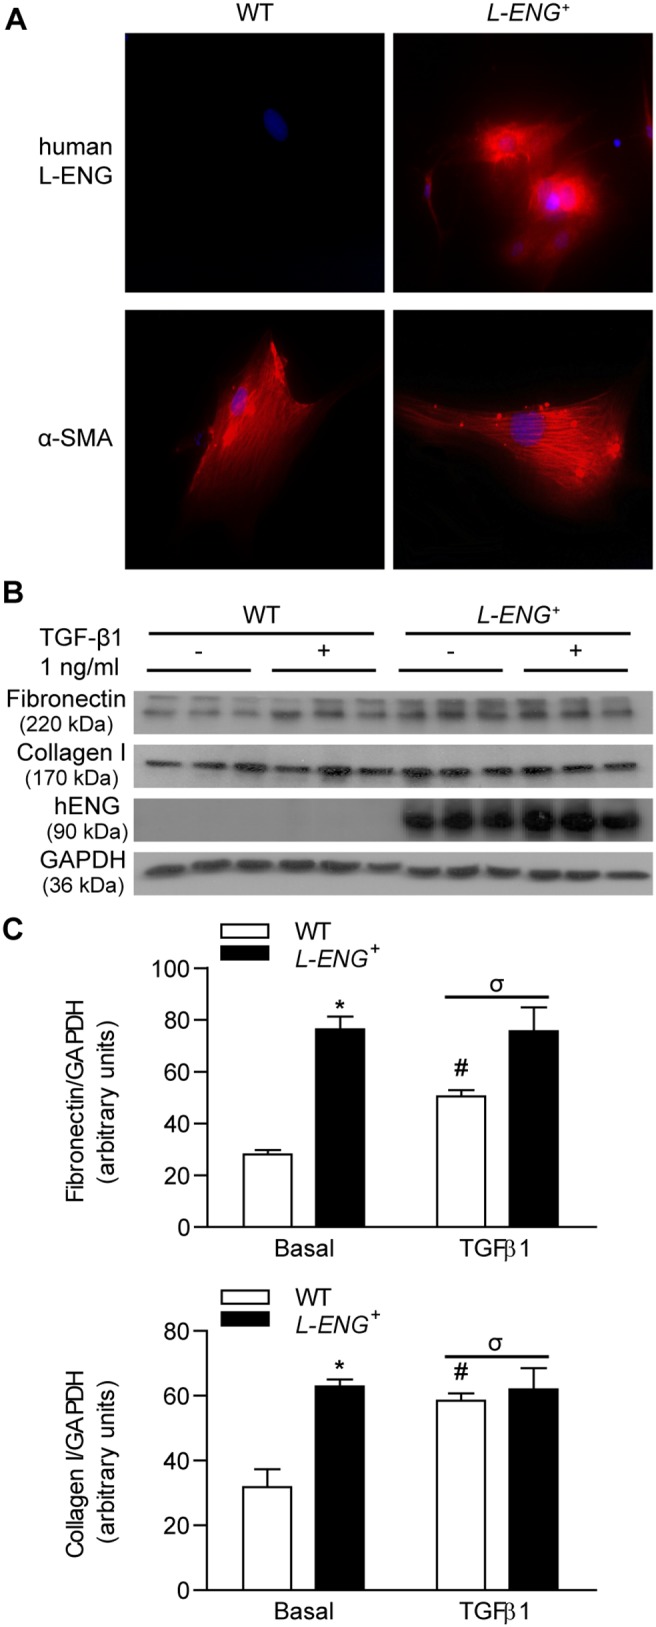
Figure 8. Effect of L-Endoglin overexpression on ECM synthesis in renal fibroblasts.

(a) Immunofluorescence of human L-Endoglin and α-SMA in WT and L-ENG + renal fibroblasts. Magnification, 1,000X. Note the presence of human L-endoglin only in L-ENG+ renal fibroblasts. (b) Effect of L-Endoglin on ECM protein levels in renal fibroblasts. Representative western blot analysis of fibronectin, collagen I, human L-Endoglin and GAPDH proteins in WT and L-ENG + renal fibroblasts under basal conditions and after TGF-β1 (1 ng/mL) treatment for 24 hours. Densitometric analysis is represented as the mean ± SEM. *P<0.01 vs. WT fibroblasts in basal conditions. #P<0.05 for TGF-β1 treatments vs. basal conditions. σP<0.05 for TGF-β1 treatment in L-ENG + vs. TGF-β1 treatment in WT fibroblasts.
