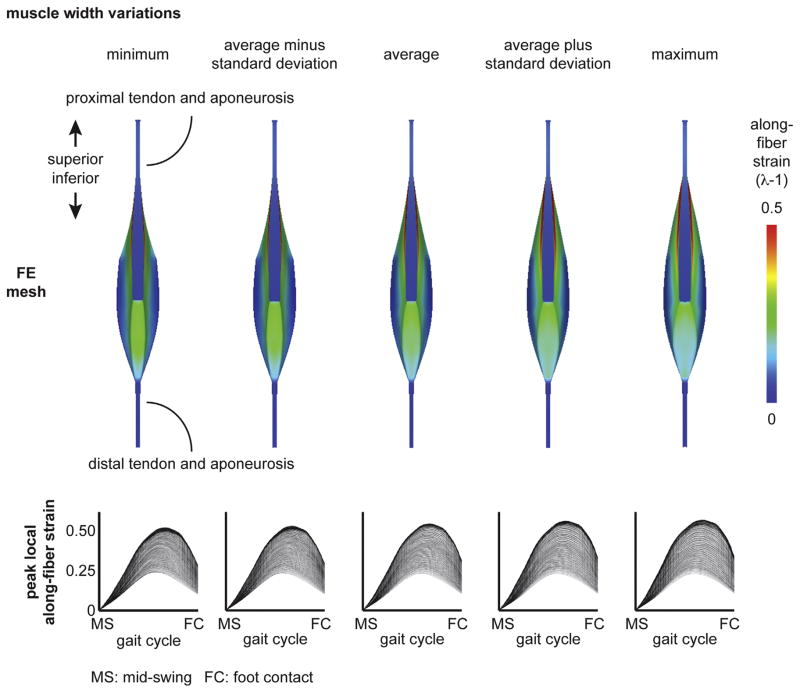
Fig. 5.
Muscle width variation results. The muscle width was varied at each superior–inferior location over a physiological range and included the minimum, the average minus one standard deviation, the average plus one standard deviation and the maximum dimensions. (Dimensions listed in Table 2.) The average model results correspond to the average dimensions across all athletes. Peak local along-fiber strain plots show the temporal variation from mid-swing to foot contact, where each line represents a single representative fiber. Plots demonstrate increasing maximum peak local along-fiber strain with wider muscle width. MS: mid-swing. FC: foot contact.

