
Fig. 6.
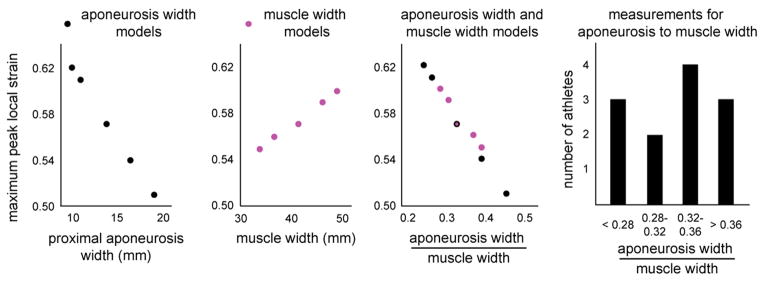
Maximum peak local strain results. Maximum peak local strain was plotted for proximal aponeurosis width and muscle width model variations. The width variations results were combined by plotting maximum peak local strain versus the ratio of proximal aponeurosis width to muscle width. The combined plot demonstrates a decreased maximum peak local strain for an increasing ratio of aponeurosis width to muscle width and the larger range of maximum peak local strain for aponeurosis width models than muscle width models. The histogram shows that the athletes’ ratios for aponeurosis width to muscle width measurements span the range of ratios used in the models.