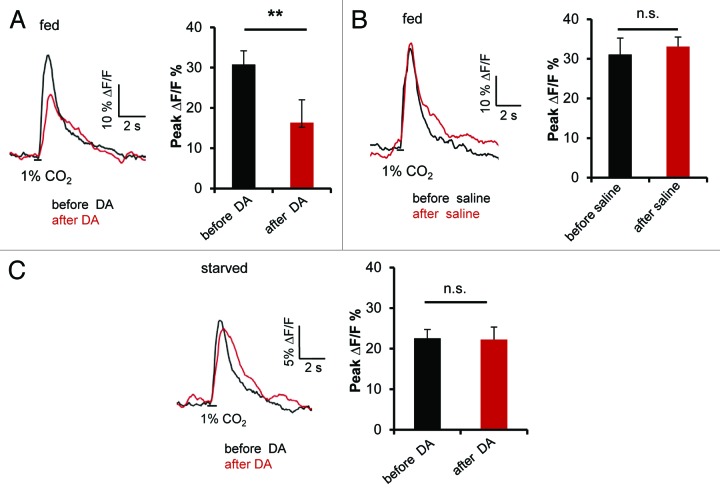
Figure 2. (A) Averaged time course and peak fluorescent intensity change in α`/β` lobe of MB186B:GCaMP5.0 flies (fed) to 1% CO2 stimulation before and after treatment with dopamine (DA).. Error bars indicate s.e.m. (n = 9). Two asterisks, P < 0.005 (Mann–Whitney test). (B) Averaged time course and peak fluorescent intensity change in α`/β`of MB186B:GCaMP5.0 flies (fed) to 1% CO2 stimulation before and after treatment with imaging saline. Error bars indicates s.e.m. (n = 6). n. s., not significant (Paired t test). (C) Averaged time course and peak fluorescent intensity change in α`/β` of MB186B:GCaMP5.0 flies (42 h starved) to 1% CO2 stimulation before and after treatment with dopamine. Error bars indicate s.e.m. (n = 9). n. s., not significant (Paired t test).

An official website of the United States government
Here's how you know
Official websites use .gov
A
.gov website belongs to an official
government organization in the United States.
Secure .gov websites use HTTPS
A lock (
) or https:// means you've safely
connected to the .gov website. Share sensitive
information only on official, secure websites.
