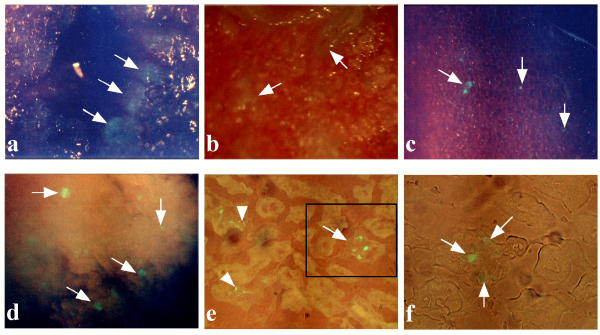
Figure 2.
EGFP fluorescence in 4% paraformaldehyde-fixed heart (a), lung (b,c) and kidneys (d-f) of mice injected 6 times with pCE-29/ FuGENE™6 complex. (a) Inner surface of the heart cut into slices. Note that the luminal surface of the heart exhibited focal and slight EGFP fluorescence (indicated by arrows). (b,c) Inner surface (b) of the lung cut into slices and outer (c) surface of the lung. Note focal or patchy expression of EGFP fluorescence in each sample (indicated by arrows). (d) Inner surface of the kidney cut into slices. Note that several glomeruli expressed EGFP fluorescence (indicated by arrows). (e) A cryostat section of the kidney in (d). Patchy expression for EGFP fluorescence (indicated by an arrow) in glomeruli was noted. Also, some renal tubules exhibited faint fluorescence (indicated by arrowheads). (f) A figure magnified from the boxed region in (e). EGFP fluorescence was patchy in the glomerulus (indicated by arrows).

