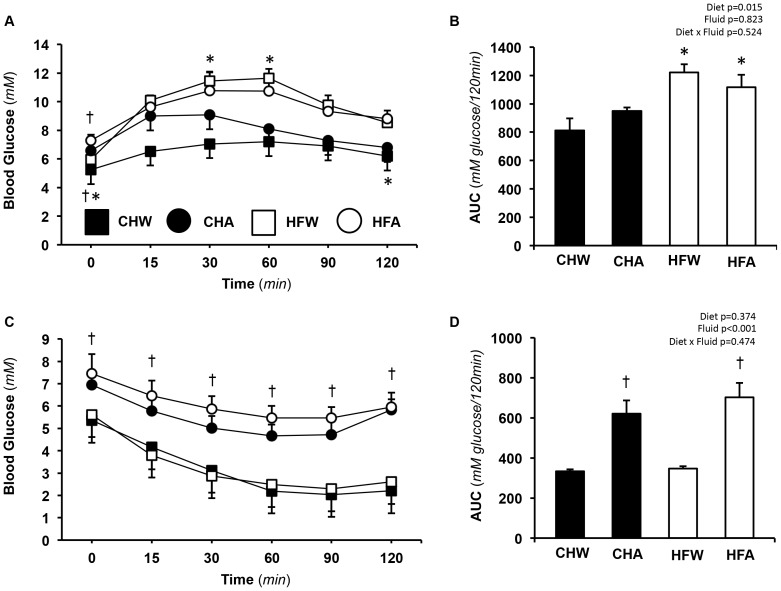
Figure 1. Measures of glucose tolerance and insulin sensitivity.
A. Blood glucose from the oral glucose tolerance test (OGTT) from 0–120 min. B. Total area under the curve for OGTT over 120 min. C. Blood glucose following an insulin tolerance test (ITT). D. Total area under the curve for the ITT over 120 min. Data represents means ± SE, n = 9–12 per treatment. † p<0.05 for fluid (water vs.aspartame) within diet (chow, high fat). Statistics (p values) for area under the curve data (diet, fluid) and their interactions are also shown, p<0.05 being considered significant. Data from the water controls (chow, high fat) were part of a shared control group that has been previously published [15]. Permission to reuse the data in this figure was obtained from Elsevier. Abbreviations are as follows; CHW, chow water; CHA, chow aspartame; HFW, high fat water; HFA, high fat aspartame.

