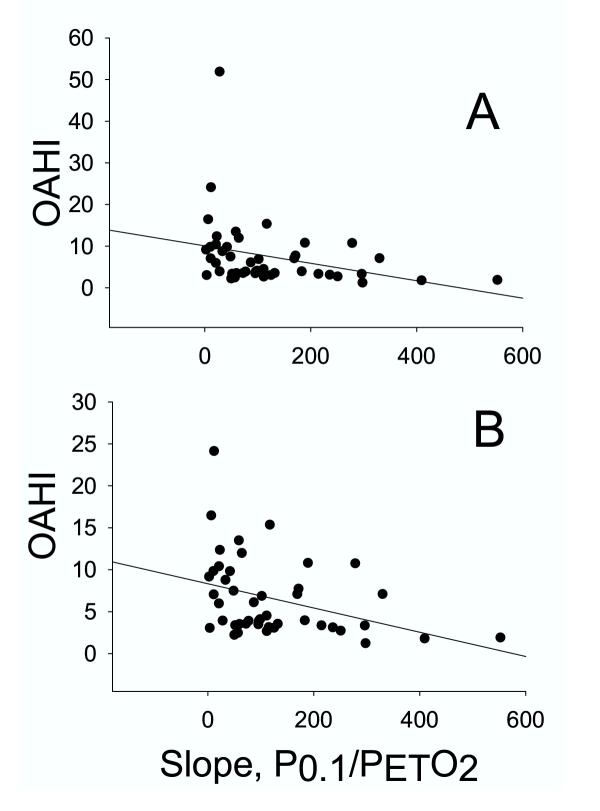
Figure 6.
Correlation between each subject's OAHI and the slope of the P0.1/PETO2 curve. The top panel represents data from all subjects, and the bottom panel shows that the relation is strengthened when the outlier with the very high OAHI is removed from the data set (see Text for details). The slope of the P0.1/PETO2 curves were obtained for each subject during the response tests, as described in Methods.

