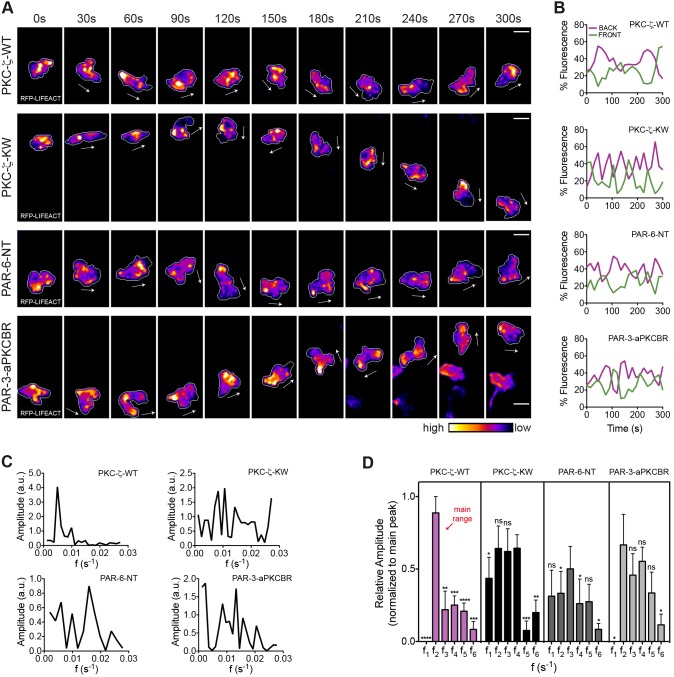
Fig. 4.
The PAR complex regulates the anteroposterior polarity of F-actin during wound-directed migration of leukocytes in vivo. (A) F-actin distribution is visualized in transgenic larvae with RFP–Lifeact and EB3–EGFP in myeloid cells, following transient coexpression of nuclear H2B–CFP and each of the indicated PAR transgenes. Frames from representative movies of migrating leukocytes in the wounded tailfin are shown. The white arrows indicate the direction of migration. Outlines of cells are shown as a gray line. Scale bars: 10 µm. (B) Timecourse of F-actin front and back fluorescence intensity distribution in the cells shown in A. (C) Fourier spectra of F-actin oscillations in the back region of the cells depicted in A. a.u., arbitrary units. (D) Comparison of histograms of F-actin oscillatory frequencies in the back region of the cell [ranges (s−1) are the same as shown in Fig. 2G]. Data are expressed as the mean±s.e.m. of all analyzed cells (PKC-ζ-WT, eight leukocytes in five larvae; PKC-ζ-KW, eight leukocytes in six larvae; PAR-6-NT, seven leukocytes in four larvae; PAR-3-aPKCBR, six leukocytes in four larvae); *P<0.05; **P<0.01; ***P<0.001; ****P<0.0001; ns, non-significant (two-tailed paired Student's t-test). See also supplementary material Fig. S4; Movie 6.

