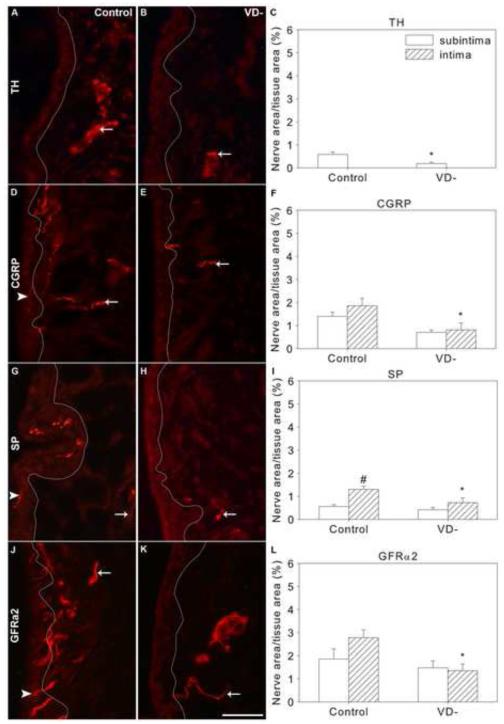
Fig. 3.
Sympathetic and sensory nerves in knee synovium of control and vitamin D deficient (VD-) rats. Representative images are shown of immunofluorescently-labeled nerves in knee synovium (A,B,D,E,G,H,J,K) from control (A,D,G,J) and VD- (B,E,H,K) rats, and graphical representation of nerve density quantitation (C,F,I,L). Synovial sections were immunofluorescently-labeled for tyrosine hydroxylase (TH, A-C), Calcitonin gene-related peptide (CGRP, D-F), substance P (SP,G-I), and GDNF family receptor alpha 2 (GFRα2, J-K). A white line has been superimposed on images to separate the intima (left) from the subintima (right) (A,B,D,E,G,H,J,K). Arrows point toward selected nerves in the subintima and arrowheads point toward selected intimal nerves. Data are presented as mean±s.e.m (C,F,I,L). # p<0.05 between intima and subintima of rats on the same diet by two-way ANOVA. * p<0.05 between control and VD- rats within the intima or subintima by ANOVA. Scale=50μm

