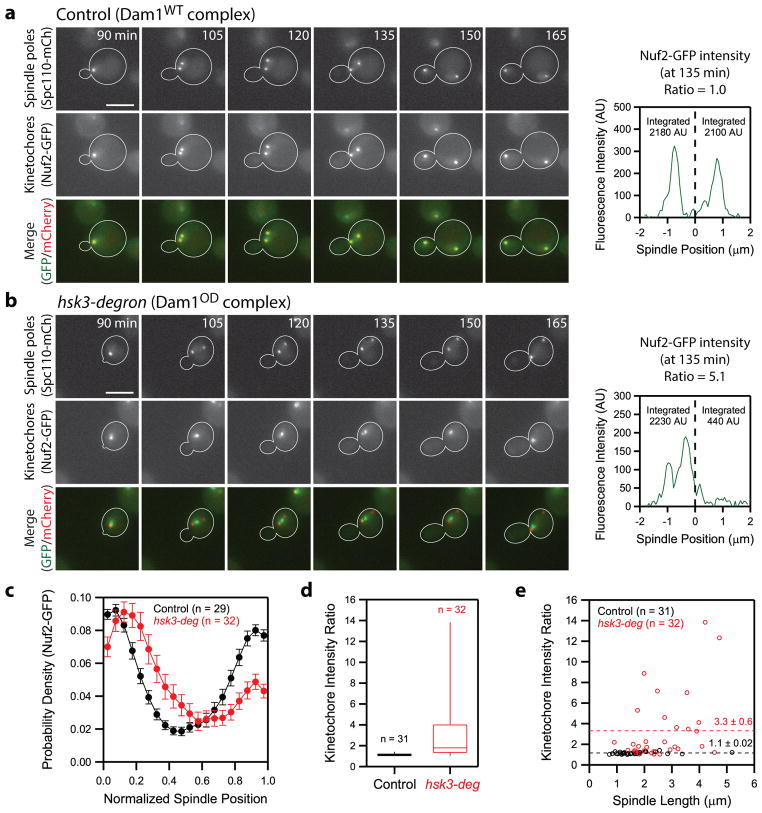
Figure 6. Equal bipolar distribution of kinetochores requires oligomerization of the Dam1 complex.
Time-lapse images of spindle poles (Spc110-mCherry, top row), kinetochores (Nuf2-GFP, middle row), and merged channels (bottom row) in control (a) and hsk3-degron (b) cells. Cells were imaged immediately following release from α-factor (G1) arrest; time stamps show time after release. Scale bars are 5 μm. At right in both (a) and (b) are spindle profiles of Nuf2-GFP intensity from corresponding images taken at 135 minutes after release. The integrated intensity in each half-spindle is printed on the plot. (c) Average spindle intensity profiles of Nuf2-GFP in control (black curve) and hsk3-degron (red curve) cells. Markers indicate average ± s.e.m. (d) Box and whisker plots show the distribution of kinetochore intensity ratios measured for control and hsk3-degron cells. Whiskers show the full range of the distribution, while the box shows the 75th, 50th, and 25th percentiles. (e) Plot of kinetochore intensity ratio versus spindle length shows that asymmetric kinetochore alignment in hsk3-degron cells is independent of spindle length. See Methods for additional information about the measurements presented in this figure.

