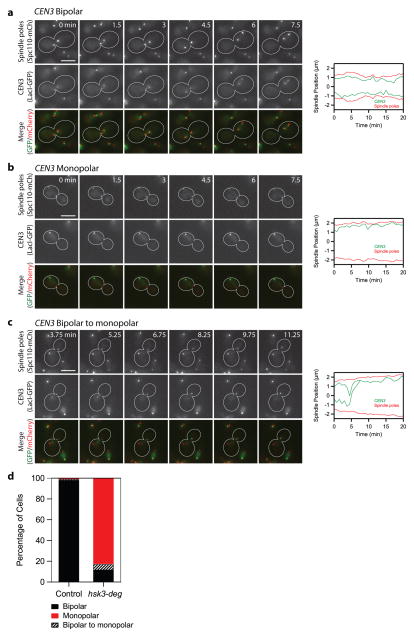
Figure 7. The oligomerization-deficient Dam1 complex fails to support sister kinetochore biorientation.
Representative time-lapse images of hsk3-degron cells show the three classes of CEN3 behavior: bioriented (a), monopolar (b), and biorientation failure (c). GFP and mCherry channels are shown separately and merged as in Figure 5. Scale bars are 5 μm; contrast was adjusted for visual clarity. Time stamps indicate elapsed time from the start of imaging. Shown to the right in (a-c) are plots of position versus time for spindle poles (red) and CEN3 spots (green) from the corresponding time-lapse series. (d) Bar graph shows the percentage of cells in each CEN3 class for control (n = 121) and hsk3-degron (n = 168) cells.

