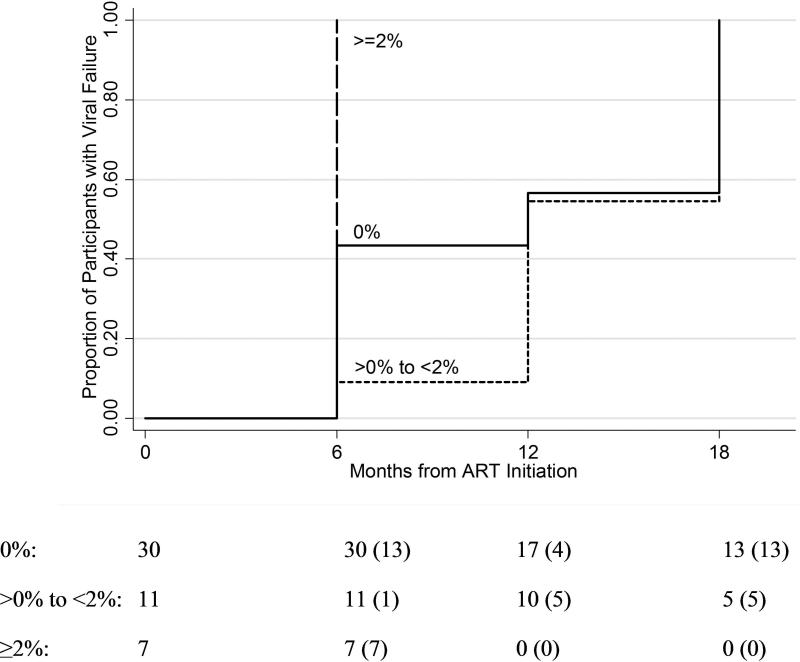
Figure 4.
Kaplan-Meier curve of time to virologic failure in participants grouped by whether or not M184V, K103N, Y181C, and/or G190A was detected in baseline (pre-ART) viral population, and if detected, the proportion of the mutant population: 0% (solid line), >0% to <2% (short dashed line), and ≥2% (long dash line).
Note: The number of participants at risk at each time point is listed and the number experiencing virologic failure is in parentheses.

