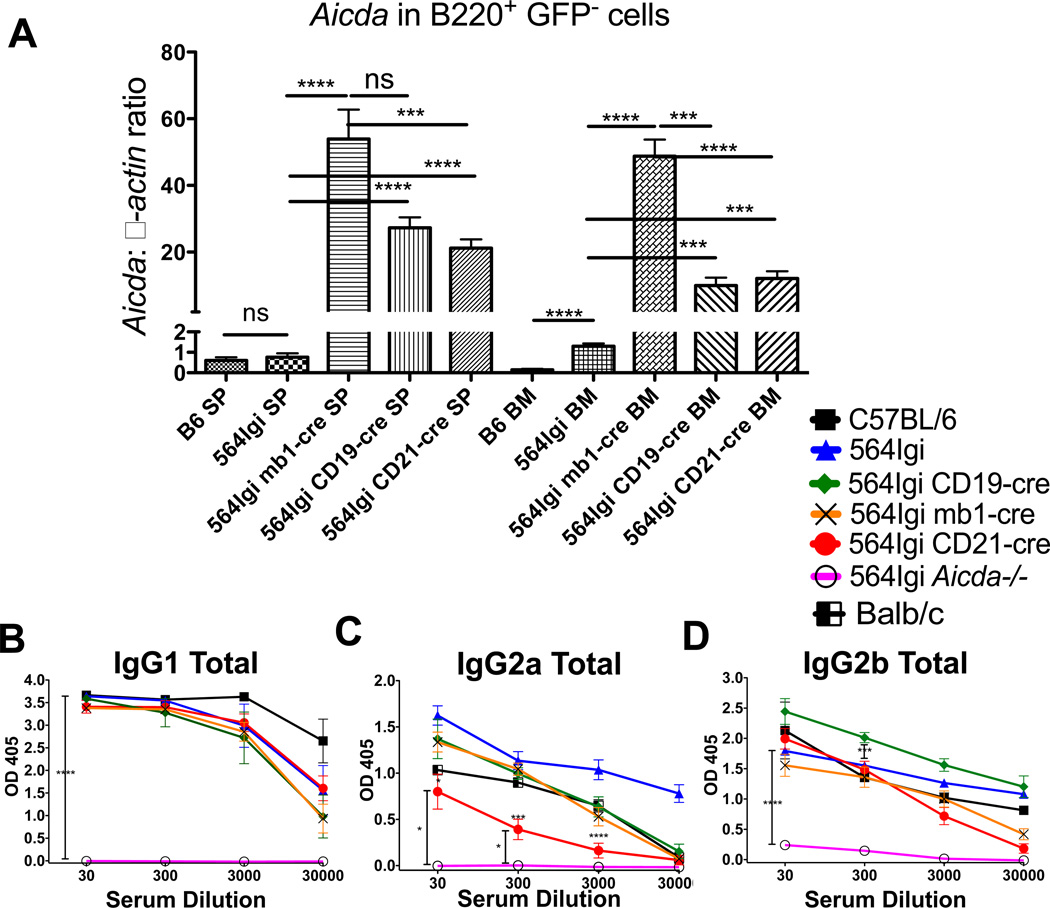
Figure 3. Aicda is upregulated in B220+ B cells from the bone marrow and spleen of 564Igi-cre mice.
(A) mRNA transcript levels of Aicda relative to β-actin in BM B220+GFP cells were measured by real-time PCR (qPCR) from C57BL/6, 564Igi, 564Igi mb1-cre, 564Igi CD19-cre, and 564Igi CD21-cre mice. Three mice were tested for each strain. Three dilutions of cDNA were tested from each mouse, and each dilution was tested in triplicate. Data are shown as the mean ± SEM of n = 3 samples and are pooled from 3 independent experiments. Mice were tested at 3 to 4 months of age. (B–D) Total antibody titers, based on isotype-specific ELISAs of (B) IgG1, (C) IgG2a, and (D) IgG2b, in the sera of the indicated mouse strains. C57BL/6, n = 4; 564Igi, n = 7; 564Igi mb1-cre, n = 9; 564Igi CD19-cre, n = 7; 564Igi CD21-cre, n = 25; 564Igi Aicda−/−, n = 8. (A–D) Statistical analysis is based on a two-tailed Student’s t-test. *p < 0.05, **p < 0.01, ***p < 0 .001 and ****p < 0 .0001.

