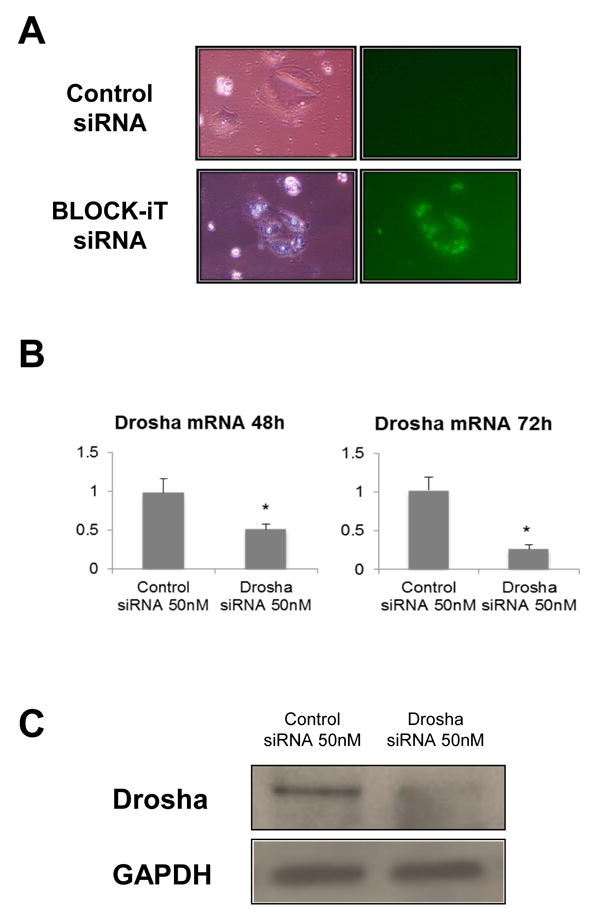
Figure 2. Drosha knockdown.

A. ATII cells cultured in A/L were transfected with a control siRNA (upper panels) or a fluorescent oligonucleotide (lower panels). Fluorescence microscopy confirmed absence of background fluorescence (upper right panel), and intracellular localization of siRNA (lower right panel). B. Knockdown of Drosha was confirmed by Real Time PCR. The results shown are normalized to 18s. A 50% and 70% reduction in Drosha mRNA was observed at 48h and 72h post-transfection, respectively (*p<0.05 vs. control siRNA, n=8). C. Protein levels of Drosha in ATII cells 72h post-transfection with Drosha and control siRNAs.
