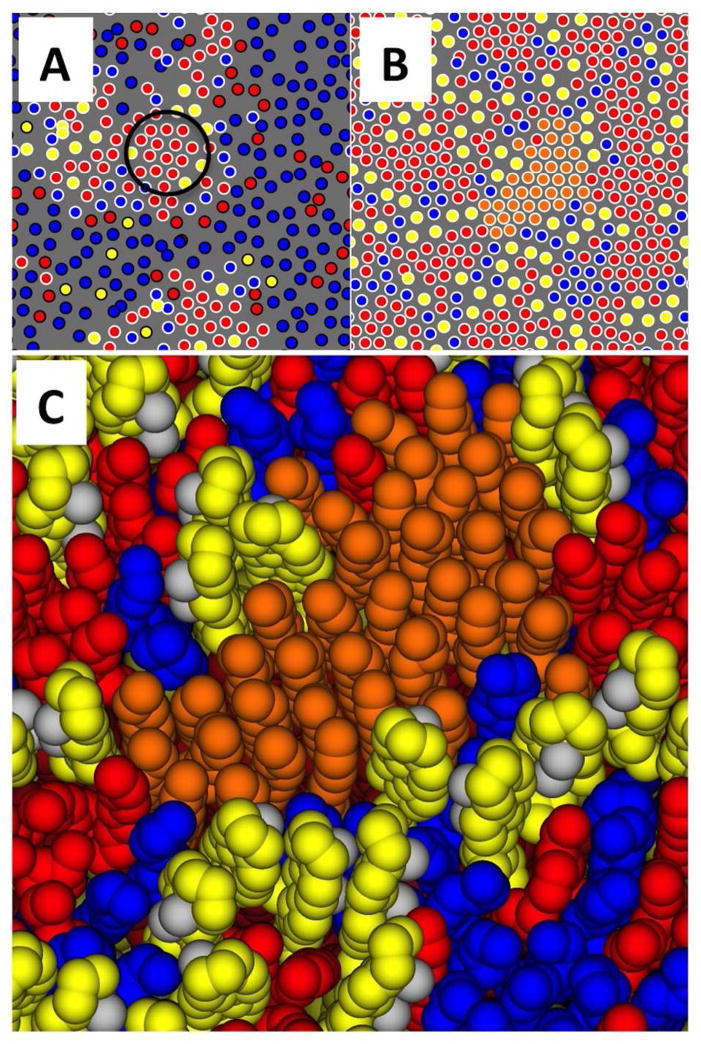
Figure 4.
Center of mass locations of lipid chains and cholesterol for one leaflet of the Lo/Ld simulation at 298 K (A) and the Lo control (B). DPPC chains red, DOPC chains blue, and cholesterol yellow, no periodic images are shown. In panel A, lipids identified as Lo by the HMM analysis are indicated by a white border, and Ld lipids are indicated by a black border. An area of locally hexagonal order is observed within the Lo region, indicated by the black circle. Within such regions, DPPC chains are well-ordered and pack tightly. The control simulation (panel B) reveals multiple locally hexagonal regions, bounded by areas enriched in cholesterol and DOPC. The molecular detail in one such region, highlighted in orange, is shown in panel C. Methyl groups on the β face of the cholesterols are colored gray, headgroups are not rendered in order to reveal the chain structure.

