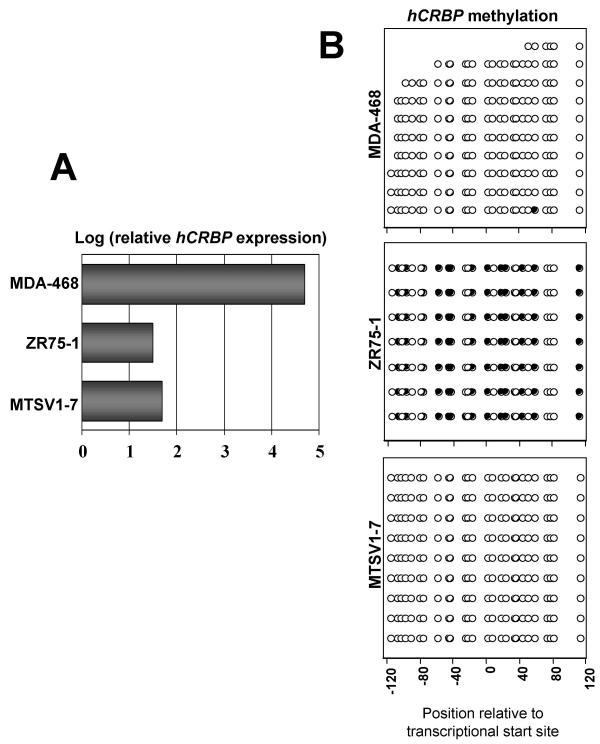
Figure 2.
hCRBP hypermethylation explains some but not all cases of hCRBP silencing. A. Relative levels of hCRBP expression determined by RT-PCR Southern analysis (see Fig. 1). The limit of detection is represented by a relative log value of 1.5 that corresponds to film background after 24 h exposure. Note that hCRBP expression in MDA-MB-468 cells is greater than that in ZR75-1 or MTSV1-7 cells by about 3 logs. B. hCRBP bisulfite sequencing results for the same cell lines as in A. Filled circles designate methylated and open circles designate unmethylated CpGs. Each row displays the methylation status of CpG sites across an individual amplicon; each "column" displays the methylation status of an individual CpG site across amplicons. The approximate position of each CpG site relative to the transcription start site is indicated in the abscissa.

