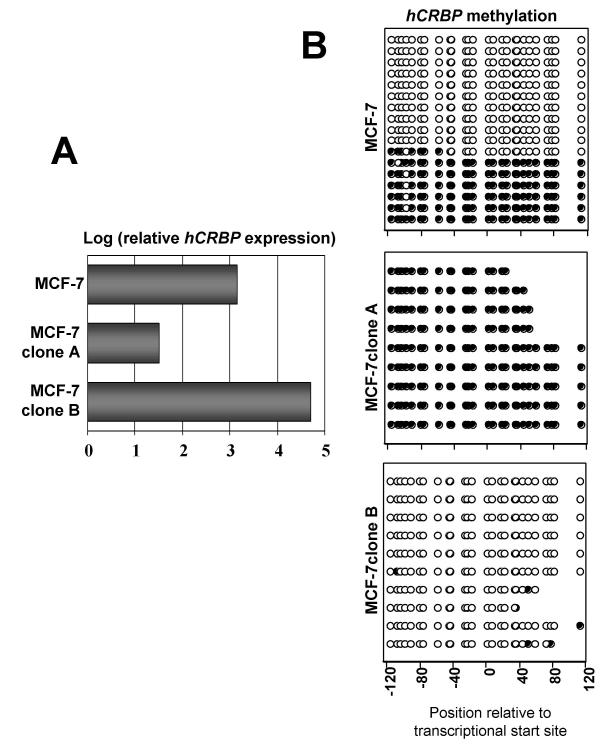
Figure 3.
hCRBP methylation explains clonal variations in hCRBP expression. A. Same as for Fig. 2A. Note that MCF-7 cells express hCRBP at a level that is intermediate to the extremes represented by MCF-7 clones A and B, which resemble in this regard ZR75-1 and MDA-MB-468 cells, respectively. B. hCRBP bisulfite sequencing results for the same cell lines as in A. Filled circles designate methylated and open circles designate unmethylated CpGs (see legend to Fig. 2B for futher details).

