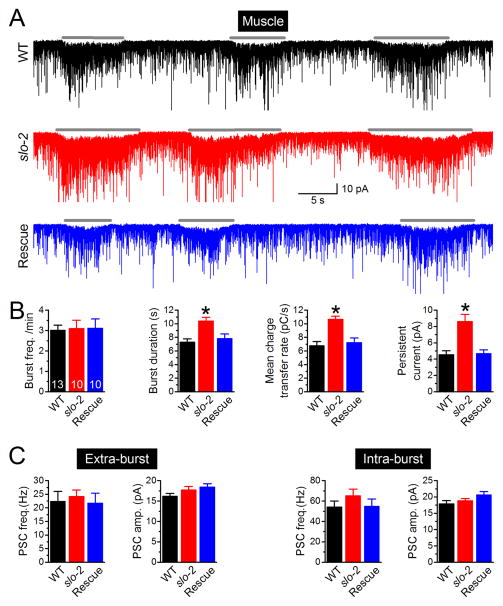
Figure 3.
SLO-2 deficiency augmented PSC bursts recorded from body-wall muscle. A. Representative traces of spontaneous PSC. The horizontal gray line marks PSC bursts. B. Comparison of PSC burst properties. C. Comparisons of extra- and intra-burst PSC events. The sample sizes (n) were 17 for wild type (WT), 15 for slo-2(nf101), and 10 for slo-2(nf101) expressing Prab-3::SLO-2::GFP (Rescue). Data are shown as mean ± SE. The asterisk (*) indicates a statistically significant difference compared with WT (p < 0.05, one-way ANOVA with Tukey’s post hoc tests). The recordings were performed with extracellular solution I and pipette solution II.

