Figure 3.


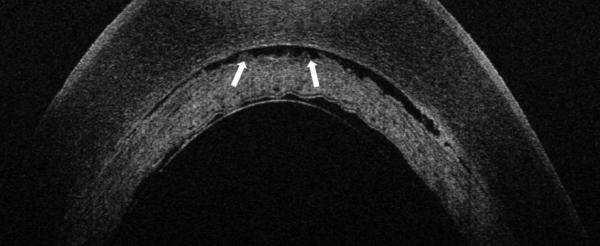
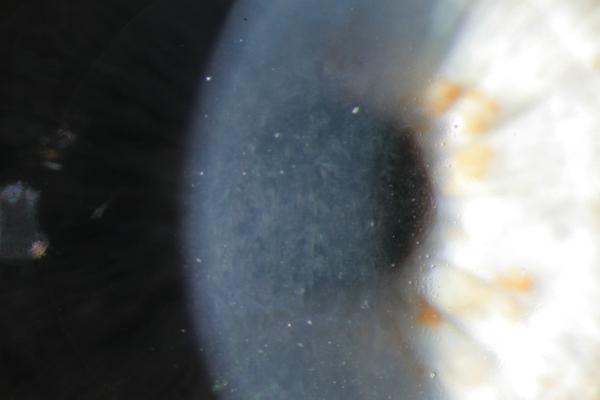
Another example of TIF seen on iOCT, with near-complete resolution of TIF on POD 1, resulting in TIO.
A. iOCT with interface space. Note the undulating contour of the stromal surface of the lenticule.
B. POD 1 OCT with near complete resolution of TIF. Arrows point to trace residual interface fluid. C. POM 1 Photo showing wave-like TIO.

