
FIG. 3.
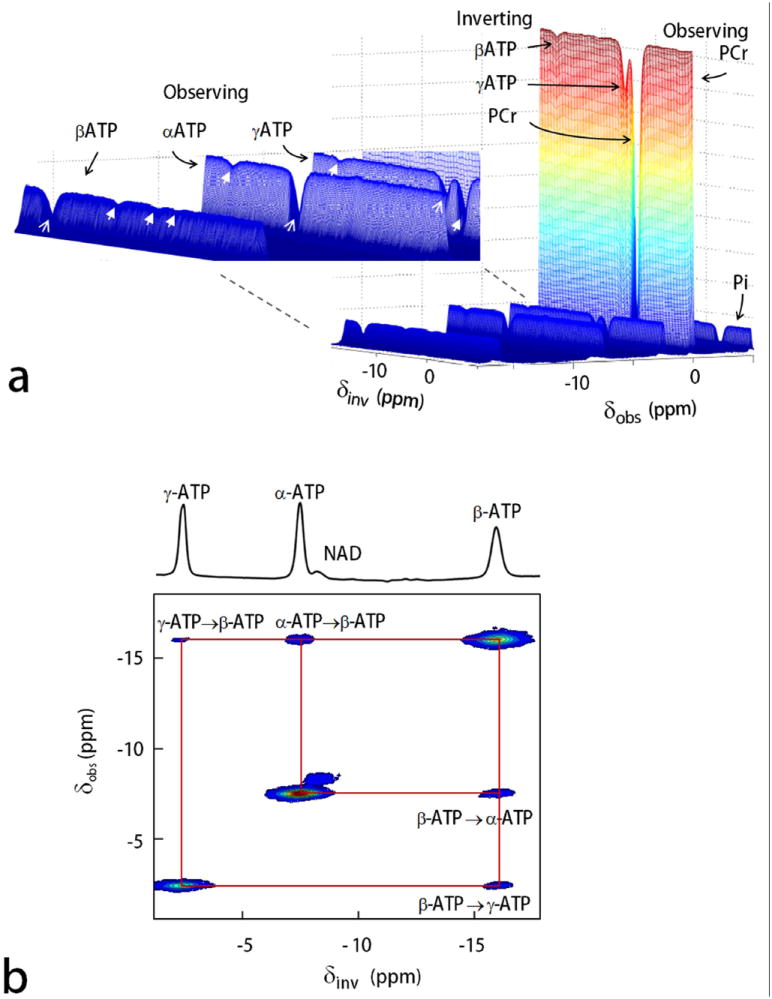
3D and 2D display of EKIT spectra of resting human calf muscle. a: 3D EKIT spectrum plotted by arraying the entire 31P MR spectra acquired using a series of offset inversion frequencies (PCr as reference at 0 ppm), with an enlarged region (inset) showing EKIT exchange peaks among the ATP spins (exchange effects marked by arrows with solid head, on-resonance inversion signals marked by arrows with thin lines). b: 2D contour plot showing ATP cross-relaxation (NOE) generated from subtraction spectra with off-resonance inversion as baseline. Note that the NAD peak which lies along the diagonal of this plot shows no exchange effect with ATP in resting skeletal muscle.