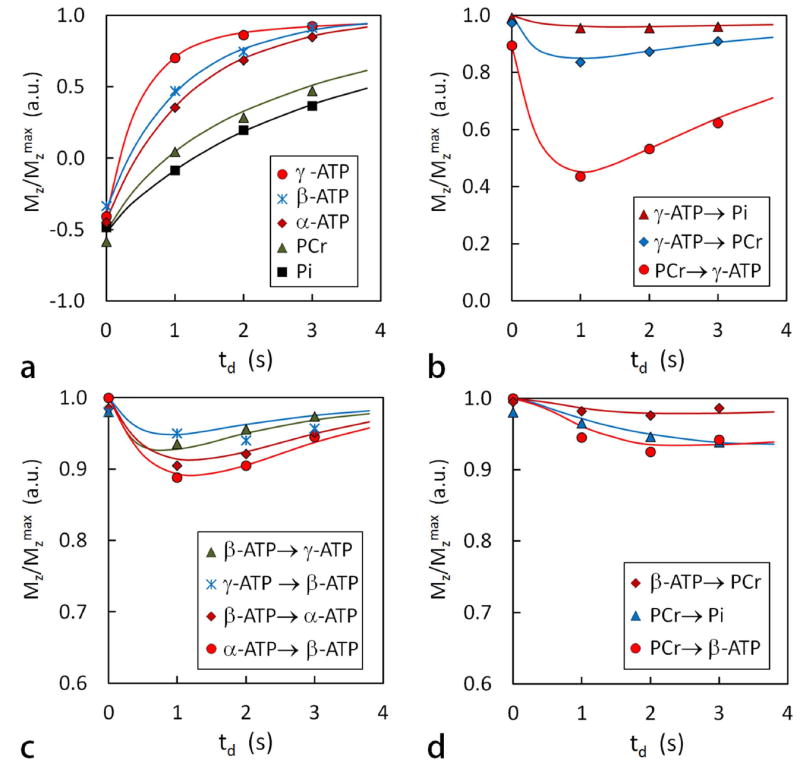
FIG. 6.

Plots of normalized EKIT peak intensity versus delay time td for several exchange processes. a: plots of Mz/Mz max after an on-resonance inversion pulse for several metabolites, b: for chemical exchanges mediated by CK and ATPase, c: for NOE within ATP, and d: for relayed MT effects. These data are identical to those shown in FIG. 5 with the solid lines showing the best fit of the data to the exchange model.
