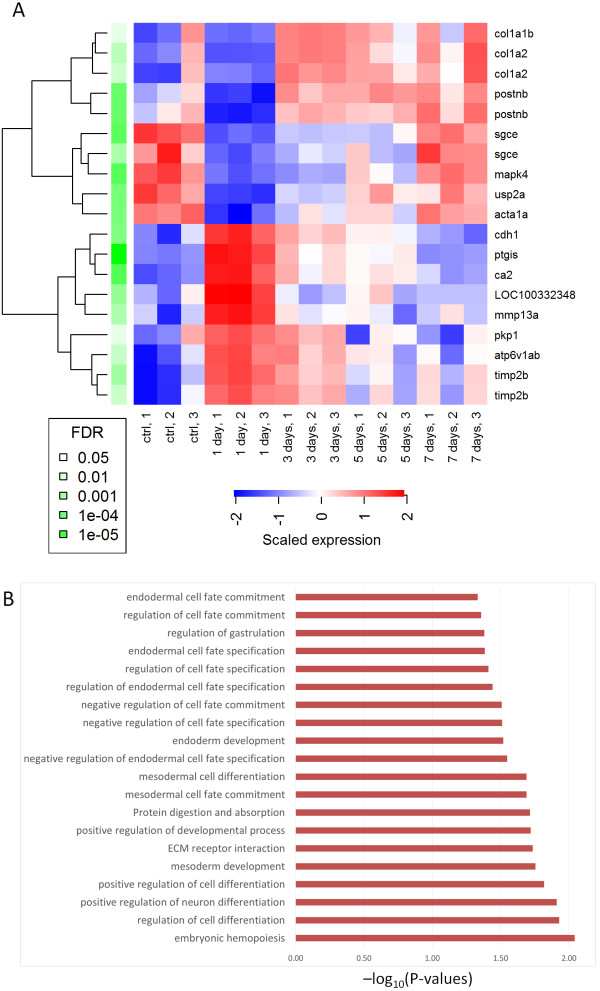
Figure 3.

Candidate genes: their transcriptional responses and potential functional implication. A: Summary of expression patterns displayed by set of top candidates. Level of the statistical significance of their expression changes across samples are shown with their corresponding FDR values. B: Statistically significant associations between candidate genes and biological processes detected by IMP (FDR-corrected P-values < 0.05) [49]. Plot shows –log10(P-values).
