
Figure 7.
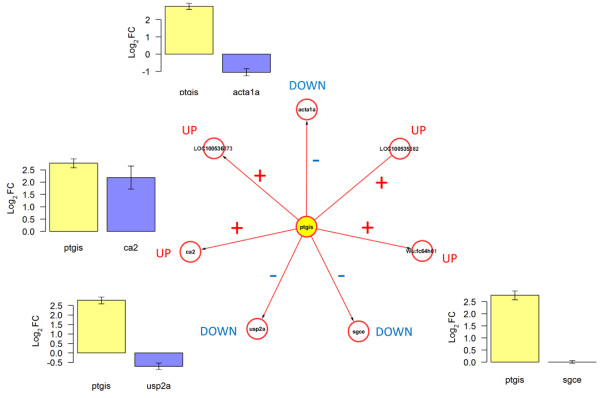
Predicted relationships between ptgis and its candidate regulated genes are reproduced in the cryoinjury model at day-3 post-injury. Plots show the Log2FC observed in independent qPCR data validation at day-3 (in relation to sham-3d). Error bars: Standard errors based on expression variability of 3 biological replicates for experimental and control conditions.