
Figure 3.
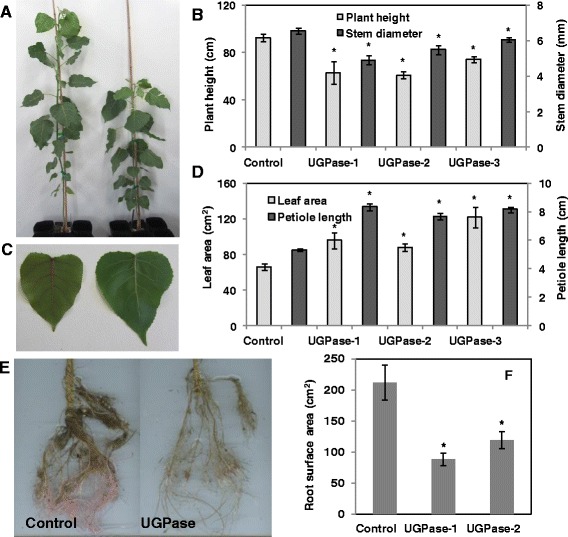
Phenotypic characterization of UGPase2 overexpression lines. Differences in plant height (A and B) and stem diameter (B), leaf area (C and D) petiole length (D) root system (E) and root surface area (F) among control and UGPase2 transgenic plants. Data represent means ± SE (n ≥ 3). * indicates statistically significant, p ≤ 0.05 based on Student’s t-tests.