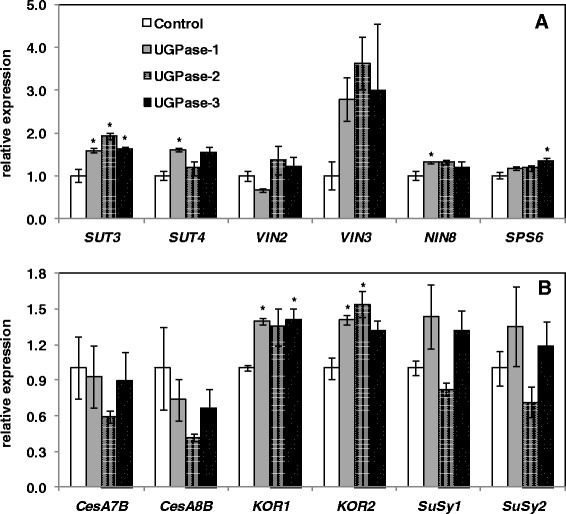
Figure 6.

Expression of selected sugar metabolism (A) and cellulose pathway genes (B) in young leaves of control and UGPase2 overexpression lines. Relative expression was calculated based on the expression of reference genes Ubiquitin-conjugating enzyme E2 and 18S ribosomal RNA. SUT, Sucrose transporter; VIN, Vacuolar invertase; NIN, Neutral invertase; SPS, Sucrose phosphate synthase; CesA, Cellulose synthase; SuSy, Sucrose synthase; KOR, KORRIGAN. Accessions: SUT3, Potri.019G085800; SUT4, Potri.002G106900; VIN2, Potri.003G112600; VIN3, Potri.015G127100; NIN8, Potri.019G082000; SPS6, Potri.018G124700; CesA7b, Potri.018G103900; CesA8b, Potri.004G059600; KOR1, Poptri.003G151700; KOR2, Poptri.001G078900; SuSy1, Potri.018G063500; SuSy2, Potri.006G136700;18S, AF206999; UBCc, Potri.006G205700. Data represent means ± SE (n = 3). *indicates statistically significant, p ≤ 0.05 based on Student’s t-tests.
