
Figure 4.
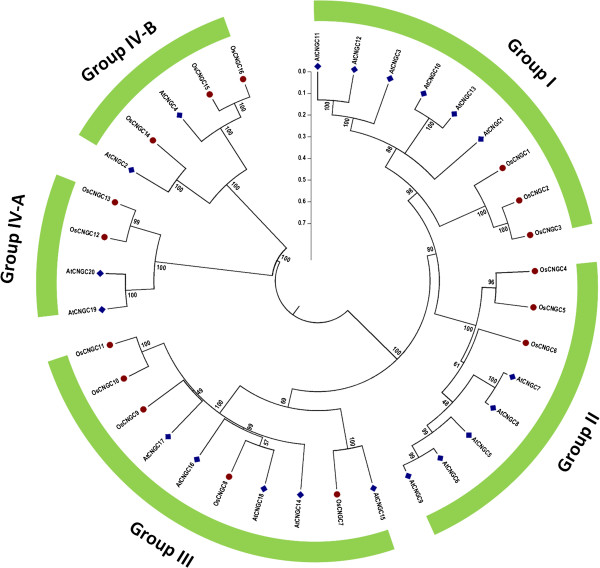
Phylogenetic tree of OsCNGC and AtCNGC proteins. The multiple alignment was performed by ClustalX program. MEGA 6.0 was used to create the maximum likelihood (ML) under the Jones-Taylor-Thornton (JTT) model. The bootstrap values from 1000 resampling are given at each node. The rice CNGC genes identified in this study are shown in red circles and Arabidopsis CNGCs are shown in blue squares. Rice CNGC genes were designated according to their order in phylogeny.