
Figure 5.
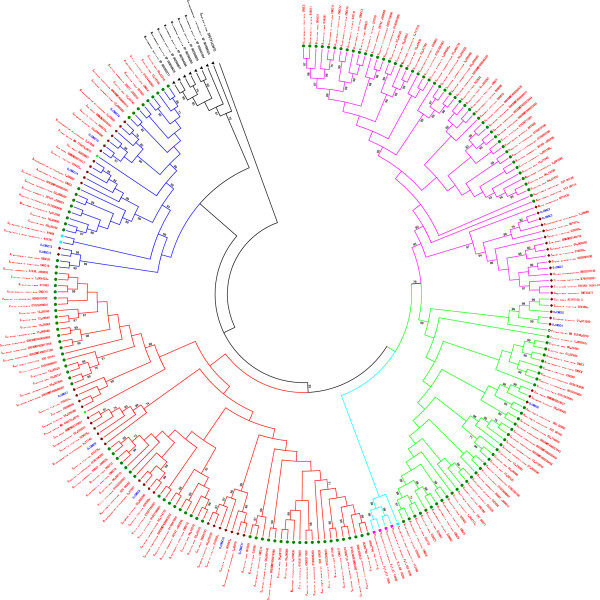
The maximum-likelihood (ML) phylogenetic tree of CNGC family genes in 235 representative plant species. The rooted maximum-likelihood (ML) phylogenetic tree was inferred from the amino acid sequences alignment of full length proteins using MEGA 6.0, under the Jones-Taylor-Thornton (JTT) model. The bootstrap values from 1000 resampling, and cut-off values >70% are given at each node. The node color specifies group i.e. pink = I, light green = II-A, aqua = II-B, red = III, blue = IV-A, and black = IV-B. Rice CNGC genes are shown in blue color. Plant lineages are shown by shapes with different colors, i.e. green circle = dicots, maroon diamond = monocots, green diamond = gymnosperms, Aqua blue square = lycophytes, pink square = moss, and black triangles = green algae.