
Figure 3.
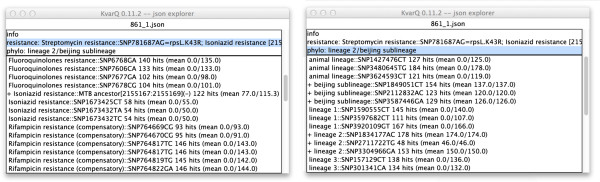
Interactive inspection of json file. The upper pane of each window in these screenshots shows the main categories of data contained in the json file. In the left window, the drug resistance section is selected and the lower pane shows details about all target sequences in this testsuite (the “+” in front of the “Isoniazide resistance” indicates a non-synonymous mutation). In the right window, the phylogenetic section is selected, showing that all SNPs for “lineage 2” and “beijing sublineage” were found.