
Figure 6.
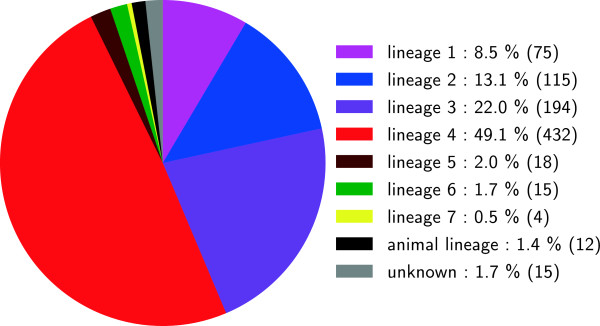
Phylogenetic classification of all 880 isolates used in this study. This figure shows the distribution of phylogenetic markers in all of the scanned genomes. For 865 isolates, an MTBC lineage-specific SNP was found. In 15 isolates, no MTBC lineage-specific SNPs were found, either because isolates were non-MTBC (10 were known to be non-MTBC), or because coverage was low.