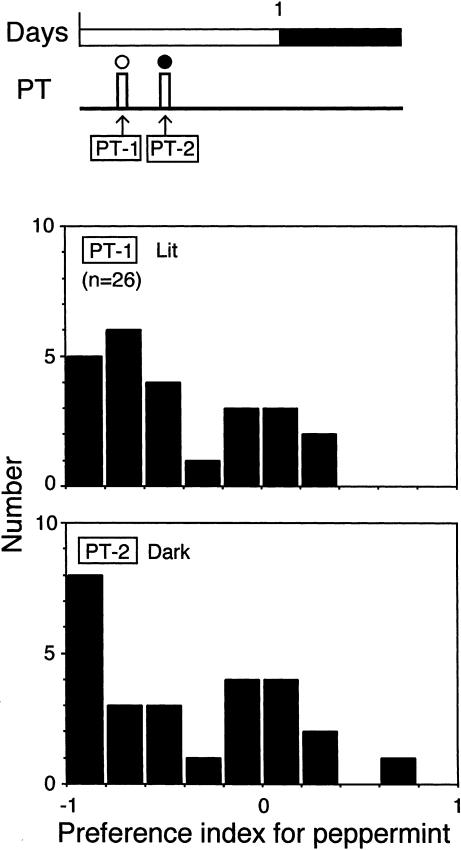
Figure 2.
Odor preference of untrained crickets tested under illumination (upper) and in the dark (lower). The diagram at the top shows the time schedule for the preference test (PT, white bars). The white and black circles above the bars indicate lit and dark conditions, respectively. The white and black parts of the time bar indicate photophase (12 h) and scotophase (12 h), respectively. Histograms show the distributions of preference index (PI) for peppermint for each individual of a group of crickets tested under illumination (PT-1) and in the dark (PT-2). The number (n) indicates sample size.

