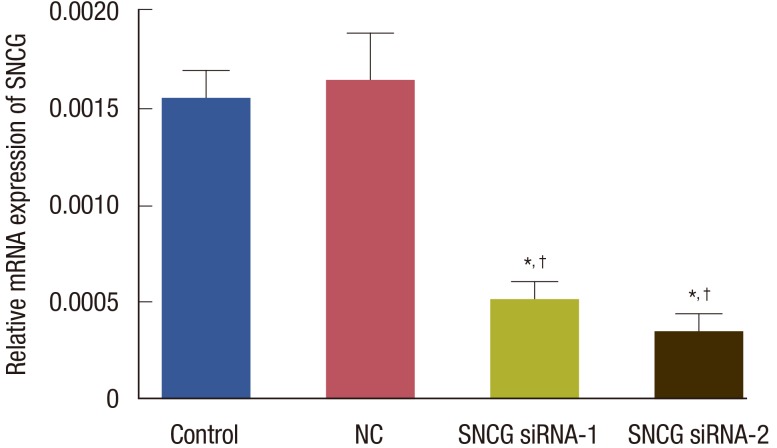
Figure 1.
The relative concentration of breast cancer specific gene 1 mRNA in each group. Synuclein-γ (SNCG) and β-actin mRNA levels were determined by fluorescent quantitative polymerase chain reaction. Levels of SNCG mRNA were found to be much lower in SNCG siRNA-1 and SNCG siRNA-2 groups than negative control (NC) (p<0.01, respectively) and control groups (p<0.01, respectively).
*p<0.01 vs. control group; †p<0.01 vs. NC group.

