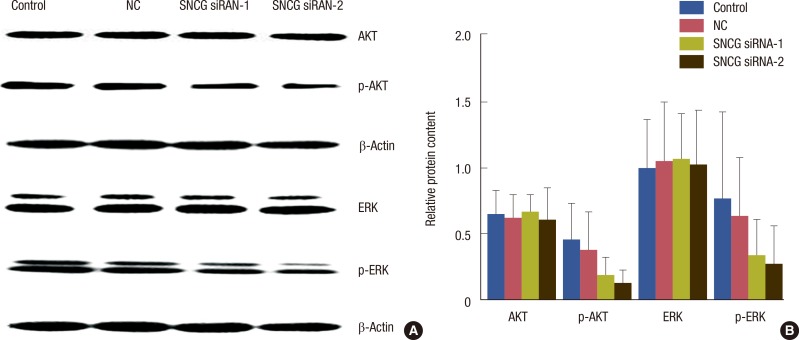
Figure 6.
Western blotting. The levels of p-AKT and p-ERK were less in Synuclein-γ (SNCG) siRNA-1 and SNCG siRNA-2 groups than negative control (NC) and control groups while there were not significant differences in the expression of AKT and ERK among the four groups. (A) Western blotting of AKT, p-AKT, ERK, p-ERK and their corresponding internal reference (β-Actin); (B) the histogram for the content of proteins in each group.

