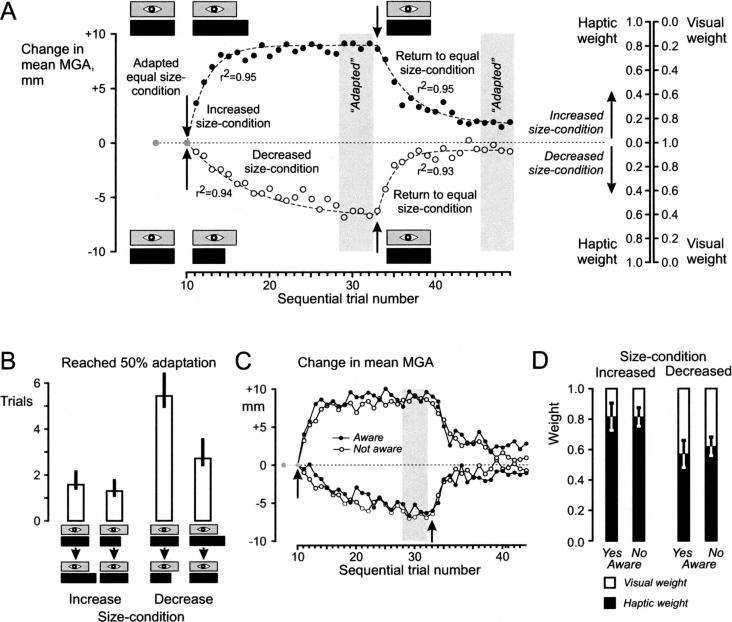
Figure 4.
Time course of adaptation process. (A) The increased- and decreased-size condition induced systematic changes in the mean MGA adopted by the subjects (the figure illustrates averages across subjects). The adaptation process was well fitted with exponential functions (broken lines, r2 values refer to fit of the four segments). Using the MGA expected if the subjects had completely adapted to the haptic size of the objects (cf. Fig. 2B), the haptic and visual weights for the increased and decreased-size condition were calculated (scales to the right). (B) Not only did subjects on average weight haptic information more in the increased-size condition, they also adapted significantly faster than during the decreased-size condition. (C,D) Irrespective of subjects' awareness of any mismatch between the size of the haptic and the visual objects, the adaptation proceeded with the same speed and to the same extent. Specifically, the haptic weight after adapting to the increased- and decreased-size condition was the same for both groups. Error bars, 0.95 confidence intervals.

