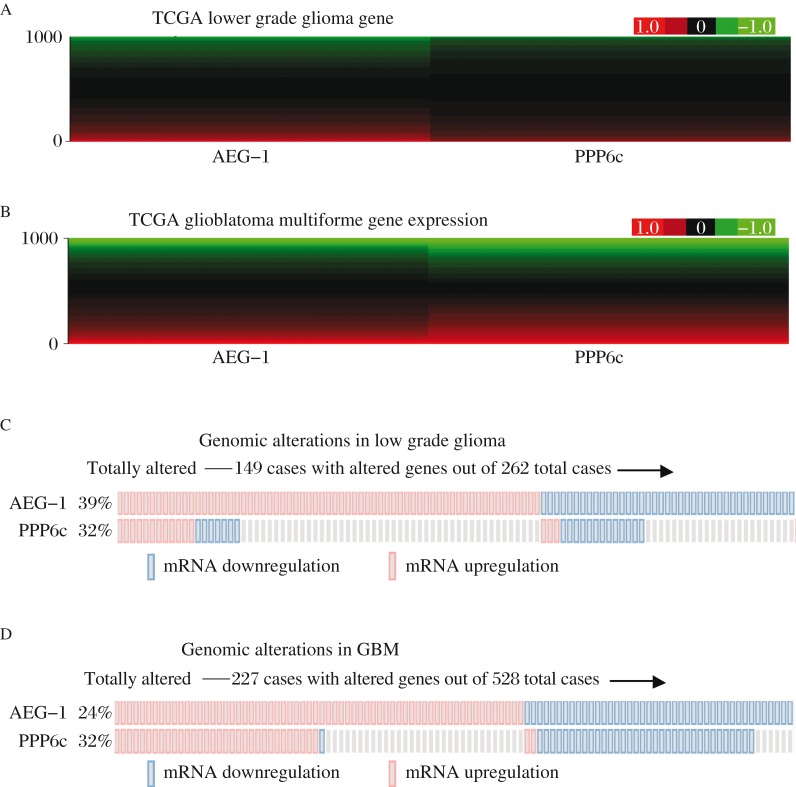
Fig. 2. The data of AEG-1 and PPP6c expression in TCGA.
Microarray shows that AEG-1 and PPP6c gene expression in brain lower grade glioma (LGG) (Fig. 2A) and Glioblastoma Multiforme (GBM) (Fig. 2B) have the similar trends. Fig. 2C and 2D show an overview of genomic alterations (legend) in AEG-1 and PPP6c (rows) affecting particular individual samples (columns). Genomic alterations of AEG-1 and PPP6c in GBM are compatible.

