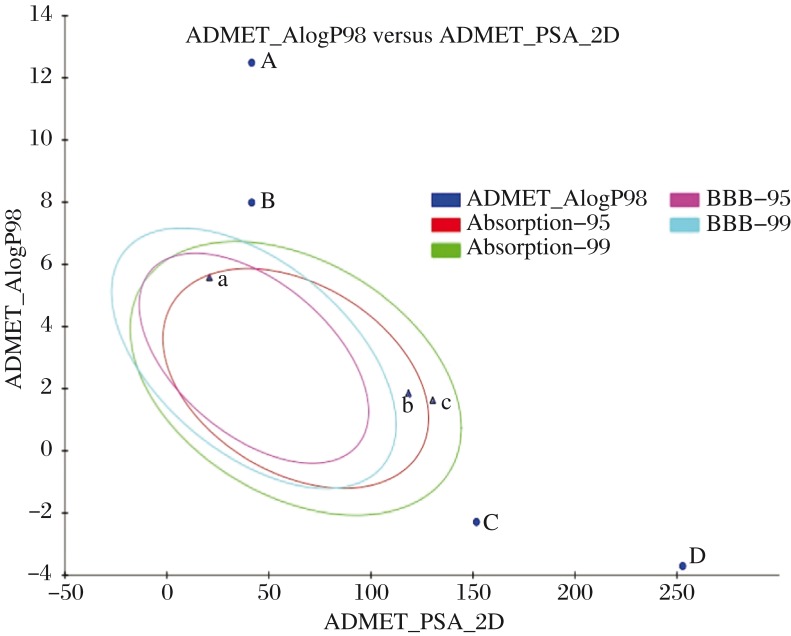
Fig. 5. Prediction of drug absorption for various compounds.
A: translutein B: zeaxanthin C: isorhamnetin 7-rhamnoside, D: quercetin 3-glucoside-7-rhamnoside, a: lutein stereoisomer, b: isorhamnetin (pure) and c: quercetin (pure) [x axis indicates the solubility of the compounds; y axis indicates the log P values] considered using Discovery Studio 2.1 (Accelrys, San Diego, CA). ADMET Descriptors, 2D polar surface area (PSA_2D) in Å2 for each compound is plotted against their corresponding calculated atom-type partition coefficient (ALogP98). The area covered by the ellipse is a prophecy of excellent absorption without any violation of ADMET properties. Ellipses indicate the absorption model at 95% and 99% confidence limit to the blood brain barrier (BBB) and intestinal absorption models.

