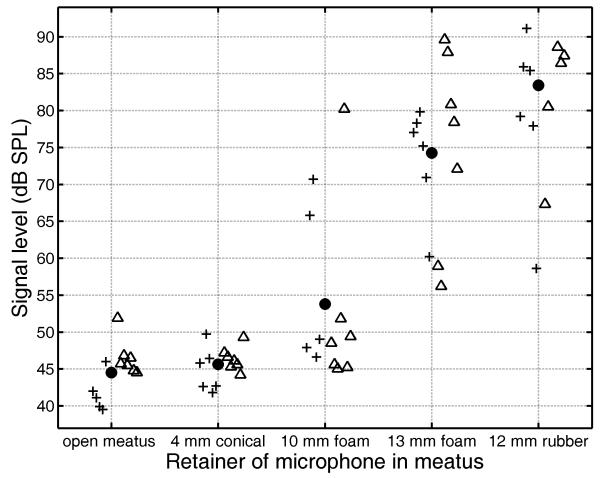
Fig. 3.
Results from the first group of participants, showing total power levels for heartbeat-synchronous waveforms for frequencies up to 28 Hz, for each eartip used to retain the microphone in the meatus. For each tip, results for female ears are shown by crosses to the left of the abscissa marker and results for male ears are shown by open triangles to the right of the abscissa marker. Grand means are shown by filled circles.

