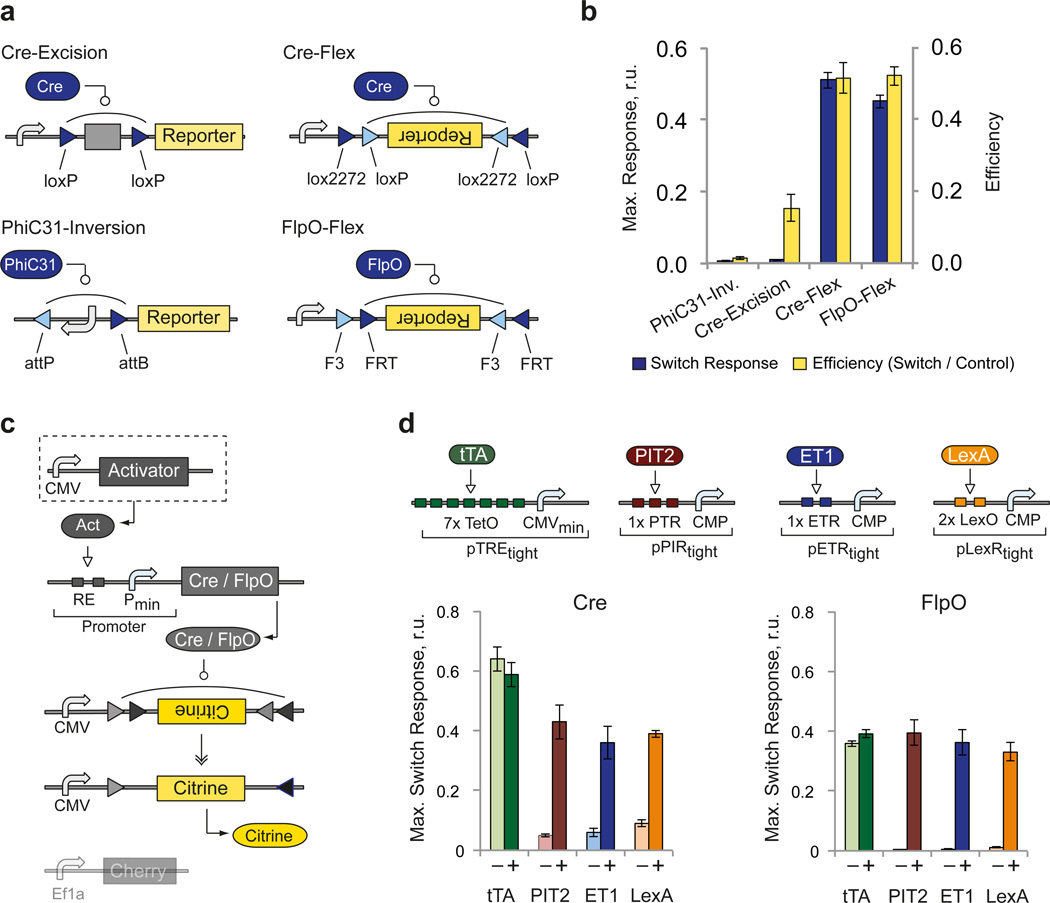
Figure 2. Performance of irreversible recombinase switches.
a | Schematics of the four tested recombinase switches based on site-specific recombinase Cre, FlpO and PhiC31. The switch constructs undergo site-specific recombination in order to express constitutively-driven reporter gene through various strategies (see also Supplementary Fig.1). Triangles indicate recombinase recognition sites. b | Maximal switch response (yellow bars) and corresponding efficiency (blue bars) of each switch. The efficiency is calculated as the ratio between recombinase-triggered reporter expression level and the expression level of pre-recombined control reporter in the presence of the same recombinase amount. Each bar represents mean±SD from three biological replicates measured 48 hours after transfection by flow cytometry (see also Supplementary Fig. 1). Plasmid amounts are provided in Supplementary Table 1. c | Schematics of the experimental setup for testing regulated recombinase activity. A CMV-driven transactivator is co-transfected with a recombinase driven by an appropriate inducible promoter and a recombinase-triggered switch. d | Top: activator-promoter combinations. Bottom: bar charts comparing the basal switch response ("−", no activator) and the maximal response observed with different transactivators ("+") (see also Supplementary Fig. 2). Each bar represents mean±SD of three biological replicates measured 48 hours after transfection by flow cytometry. Plasmid amounts are provided in Supplementary Table 2 and quantitative readouts of key samples in Supplementary Table 3.

