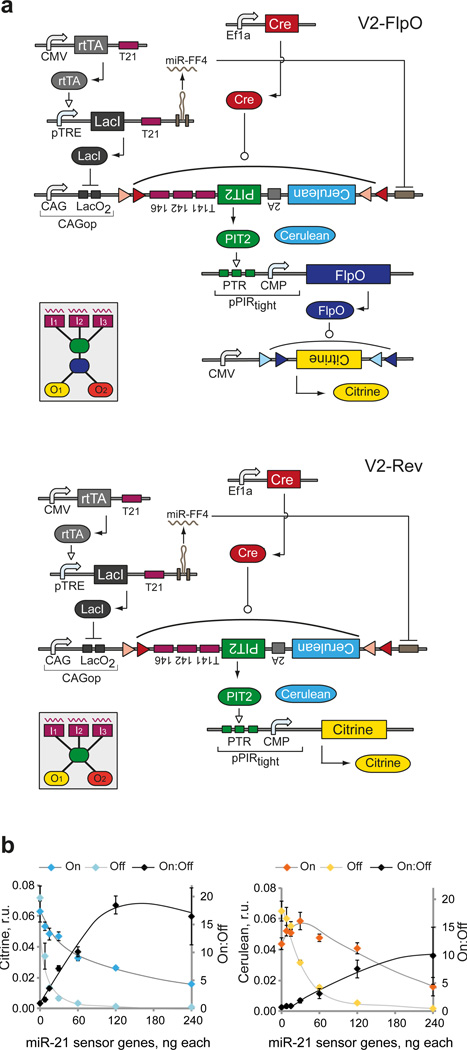
Figure 4. Second-iteration bow-tie circuit instantiation and preliminary characterization.
a | Detailed schematics of second-iteration circuits: irreversible V2-FlpO (top) and reversible V2-Rev (bottom). DNA and RNA species are lumped together, with transcriptional regulation and recombination taking place at the DNA level and splicing/RNAi at the RNA level. Different genetic building blocks are indicated. The insets show the high-level diagrams of the corresponding bow-tie architectures. b | Dose response of the On and Off readouts and the On:Off ratio to the amount of sensor-encoding plasmids in V2-FlpO. The amounts of miR-21 sensor genes are changed simultaneously, while all the other components are kept constant. Left and right charts show the changes in Cerulean and Citrine readouts, respectively. Both charts show mean±SD of three biological replicates with manually drawn curves serving as visual guides. Error propagation rules were applied to calculate the SD of the ratio. Plasmid amounts are provided in Supplementary Table 5.

