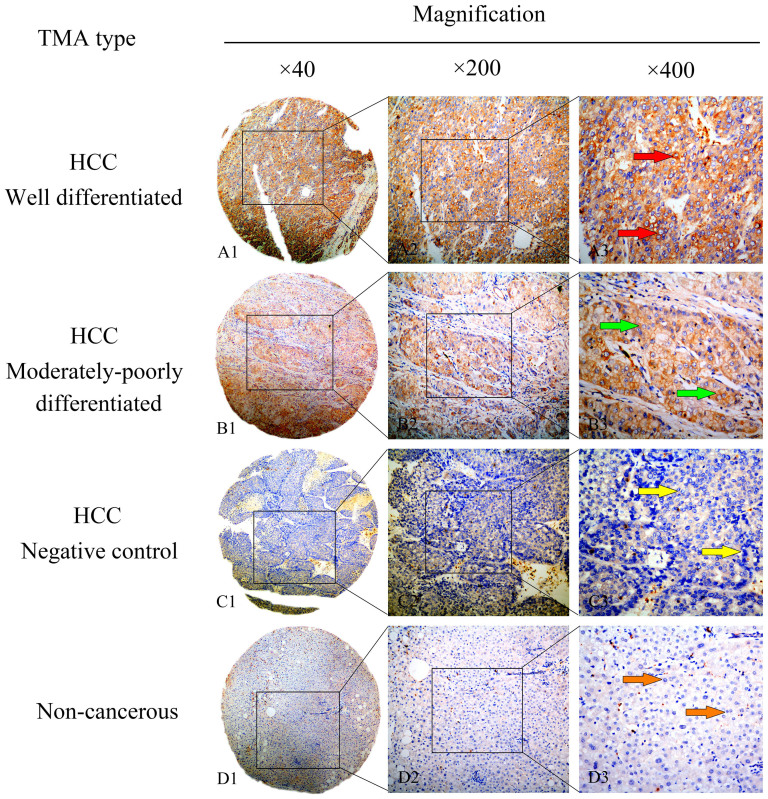
Figure 3. Representative pattern of MAGE-A9 protein expression in HCC and corresponding non-cancerous tissues with tissue microarray (TMA).
A1, A2 and A3 High immunohistochemical (IHC) staining of MAGE-A9 in well differentiated HCC sample. Red arrow shows positive staining in the membrane and cytoplasm of cancer cells. B1, B2 and B3 High IHC staining of MAGE-A9 in moderately-poorly differentiated HCC sample. Green arrow shows positive staining in the membrane and cytoplasm of cancer cells. C1, C2 and C3 Negative IHC staining of MAGE-A9 in HCC sample as negative control. Yellow arrow shows negative staining of HCC cells. D1, D2 and D3 Negative IHC staining of MAGE-A9 in non-cancerous tissue sample. Orange arrow shows negative staining of non-cancerous cells. Original magnification ×40 in A1, B1, C1 and D1; ×200 in A2, B2, C2 and D2; ×400 in A3, B3, C3 and D3.

