
Fig. 5. Correlation Between WNT, CUX1 and GLIS1 Gene Expression in a Human Breast Tumor Dataset.
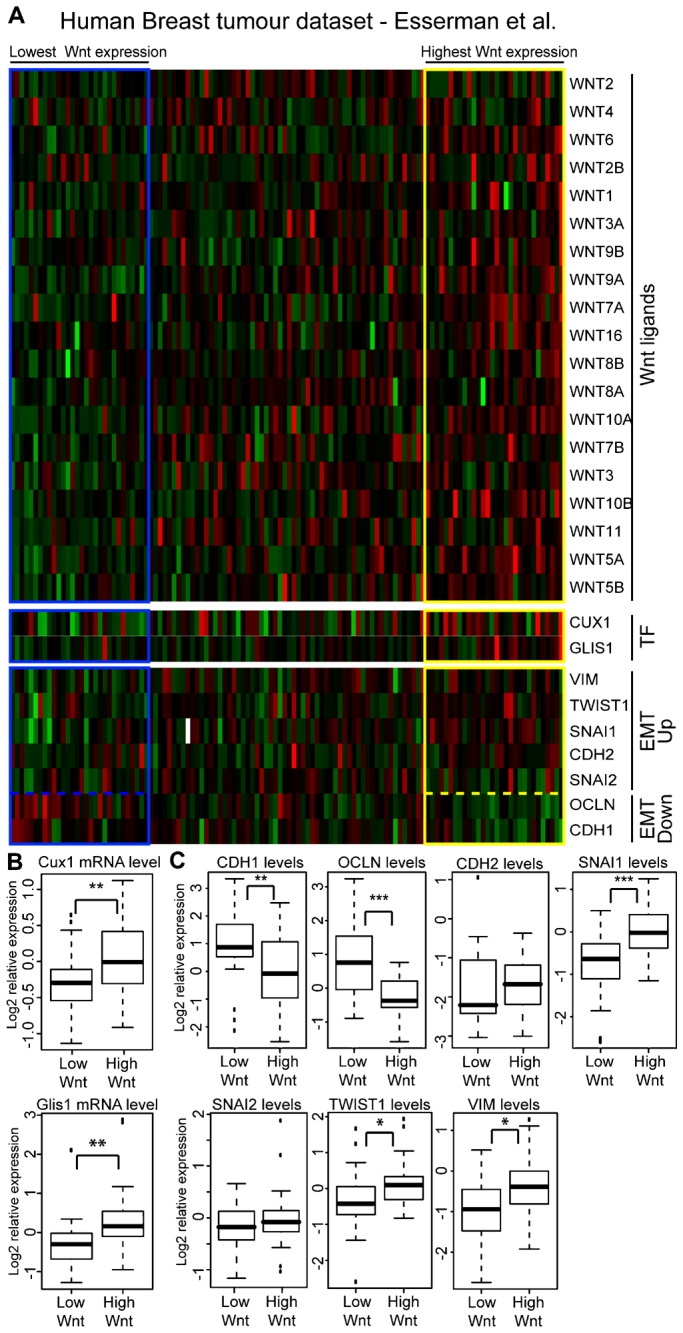
(A) Heatmap of a human breast tumor dataset sorted according to WNT genes expression using the BreSAT algorithm. Expression of CUX1, GLIS1, VIM, TWIST1, SNAI1, CDH2, SNAI2, OCLN and CDH1 in each tumor is shown below. (B) CUX1 and GLIS1 expression in the top 25% and bottom 25% samples sorted according to WNT genes expression. * indicates p<0.05, ** <0.01, *** <0.001 on a Welch-corrected student's T test. (C) CDH1, OCLN, CDH2, SNAI1, SNAI2, TWIST1 and VIM expression in the top 25% and bottom 25% samples sorted according to Wnt genes expression. * indicates p<0.05, ** <0.01, *** <0.001 on a Welch-corrected student's T test.