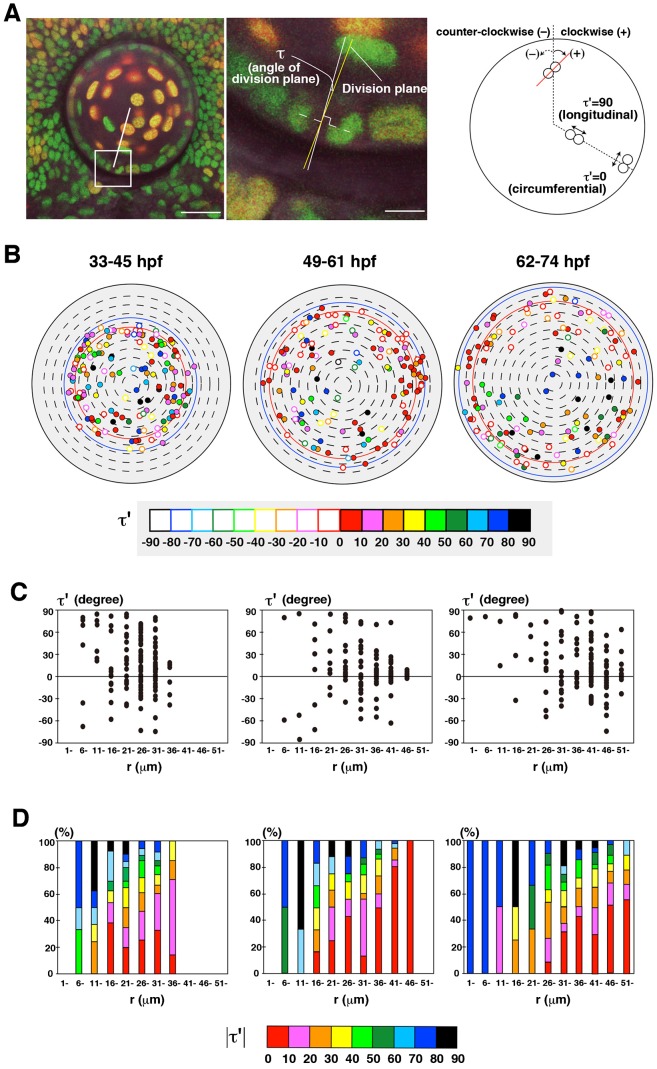
Fig. 4. Cell-division orientation in zebrafish lens epithelium.
(A) Measurement of the orientation of cell division. Cell-division orientation is defined as τ′, the angle between the line connecting segregating daughter cell chromatins and the circumferential line of the lens sphere. τ′ was calculated from τ, the angle between the r-axis and the cell-division plane, which was perpendicular to the line connecting segregating chromatins (see Materials and Methods). τ′ = 0 and 90 indicate circumferential and longitudinal cell division, respectively. Plus and minus indicate clockwise and counter-clockwise orientation, respectively. (B) Plotting of cell-division orientation in a projection view of the lens epithelium at three time windows: 33–45, 49–61, 62–74 hpf. Samples of mitoses were the same as shown in Fig. 3A. Cell-division orientation is indicated by color codes red (τ′ = 0–10), pink (τ′ = 11–20), orange (τ′ = 21–30), yellow (τ′ = 31–40), light green (τ′ = 41–50), dark green (τ′ = 51–60), light blue (τ′ = 61–70), blue (τ′ = 71–80), and black (τ′ = 81–90). Closed and open circles indicate clockwise and counter-clockwise orientations, respectively. (C) Plotting of τ′ of individual mitotic cells along the r-axis. Mitotic cells with low τ′ value (−30<τ′<30) is zero in the most anterior region (0<r<10), but increased in the peripheral region. Furthermore, the number of cells with the positive value of τ′ is higher than that of the negative value in all stages. (D) Histogram of absolute τ′ value along the r-axis. The fraction of cells with circumferential cell division is low in the anterior region, but gradually increased in a peripheral direction, and was dominant in the peripheral region. Scale bars: 20 µm (A, left panel), 5 µm (A, right panel).

