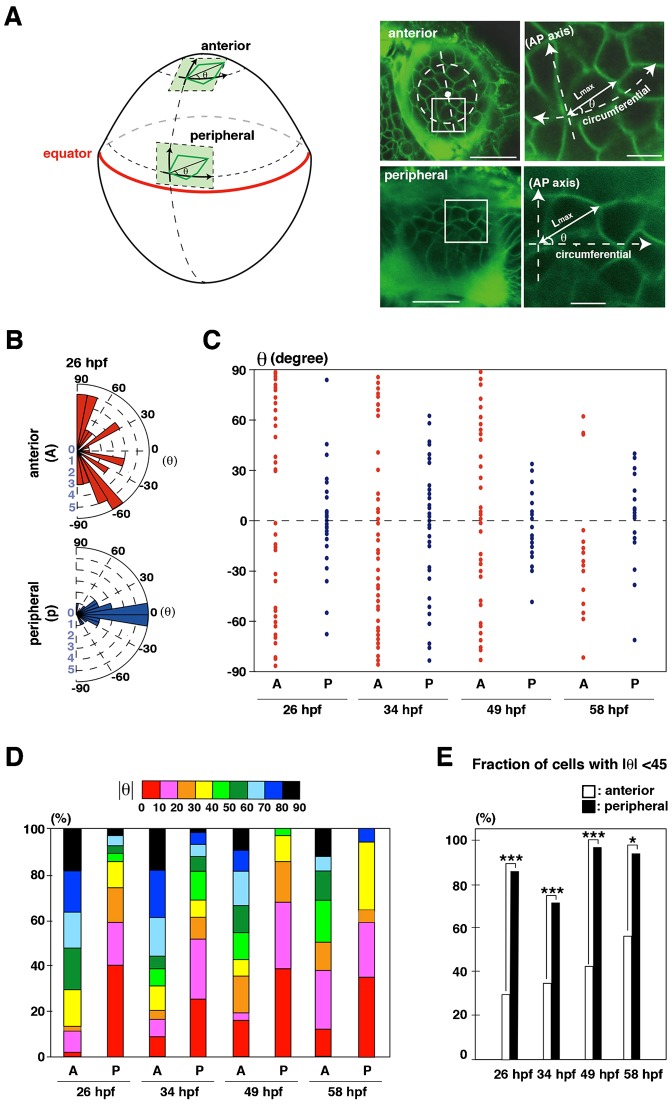
Fig. 5. Orientation of the long axis of lens epithelial cells.
(A) The orientation of the long axis is defined as the angle θ between the long axis and the circumferential line of the lens sphere. Plus and minus values indicate clock-wise and counter-clockwise directions. (B) Graph of the long-axis orientation at 26 hpf. Red and blue bars indicate the number of cells with a particular range of angle in the anterior and peripheral region, respectively. Longitudinal orientation is prominent in the anterior region, whereas circumferential orientation is prominent in the peripheral region. (C) Plotting of θ at 26, 34, 49 and 58 hpf. Red and blue dots represent individual epithelial cells in the anterior and peripheral regions, respectively. Circumferential orientation (−45°<θ<45°) is prominent in peripheral region. There seems to be no bias between the clockwise and counter-clockwise directions. (D) Histogram of absolute θ. Long-axis orientation is indicated by color codes. 30–50% of lens epithelial cells have θ less than 40° in the anterior region, but 70–95% do in the peripheral region, suggesting that longitudinal and circumferential orientations are prominent in anterior and peripheral regions, respectively. (E) Percentage of the number of lens epithelial cells whose long axis is circumferentially oriented (−45°<θ<45°). The long axis is circumferentially oriented in the peripheral region through all stages. Probability was calculated by χ2-test: *p<0.05, ***p<0.005. Scale bars: 20 µm (A, left panels), 5 µm (A, right panels).

