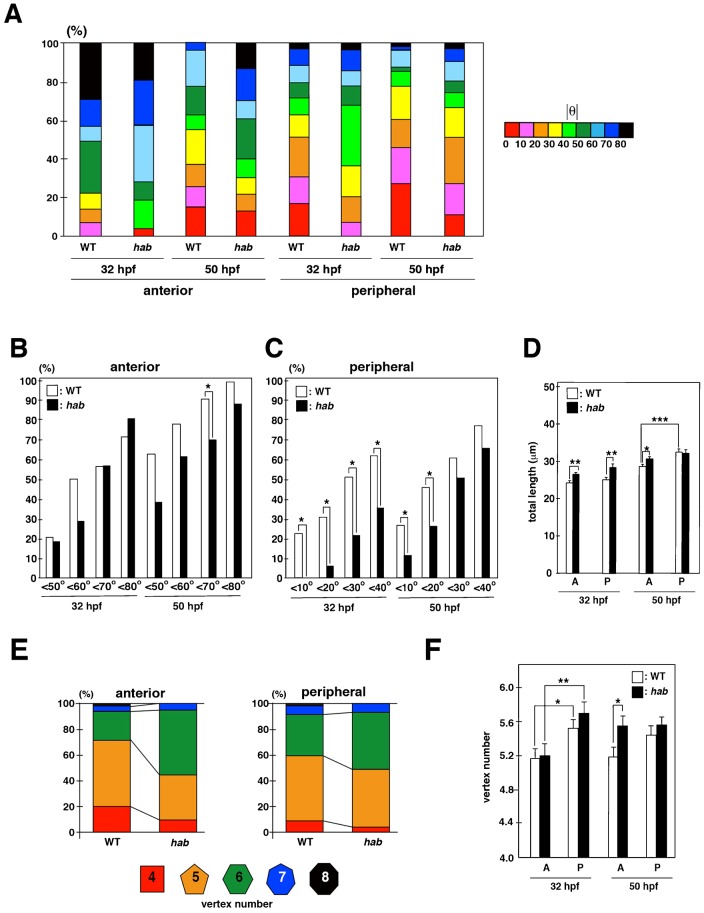
Fig. 7. E-cadherin is required for circumferential orientation of the long axis.
(A) Histogram of long-axis orientation in wild-type sibling and habrk3 mutants at 32 and 50 hpf. (B,C) Comparison of the percentage of long-axis orientation with different values of absolute θ between wild-type sibling and habrk3 mutants at 32 and 50 hpf in anterior (B) and peripheral (C) regions. Fraction of the long axis θ<70 is significantly higher in wild-type sibling than in habrk3 mutants at 50 hpf (B). The fraction of the circumferentially biased long axis (θ<40 at 32 hpf and θ<20 at 50 hpf) is higher in wild-type sibling than in habrk3 mutants (C). Probability was calculated by χ2-test: *p<0.05. (D) Average perimeter length of lens epithelial cells in the anterior and peripheral regions. In wild type, perimeter length is longer in the peripheral region than in the anterior region at 50 hpf. Perimeter length is longer in habrk3 mutants than in wild type in both anterior and peripheral regions at 32 hpf and in the anterior region at 50 hpf. Bars and lines indicate average and standard error. t-test: *p<0.05, **p<0.01, ***p<0.005. (E) Percentage of vertex number of lens epithelial cells in the anterior and peripheral regions at 50 hpf. (F) Average vertex number in the anterior and peripheral regions. Vertex number is higher in the peripheral region than in the anterior region of wild-type sibling and the habrk3 mutants at 32 hpf. Vertex number in both anterior and peripheral regions is not statistically different between wild type and the habrk3 mutants at 32 hpf. At 50 hpf, vertex number in the anterior region is higher in habrk3 mutants than in wild-type sibling, whereas vertex number in the peripheral region is not different between wild-type sibling and habrk3 mutants. Bars and lines indicate average and standard error. t-test: *p<0.05, **p<0.01.

