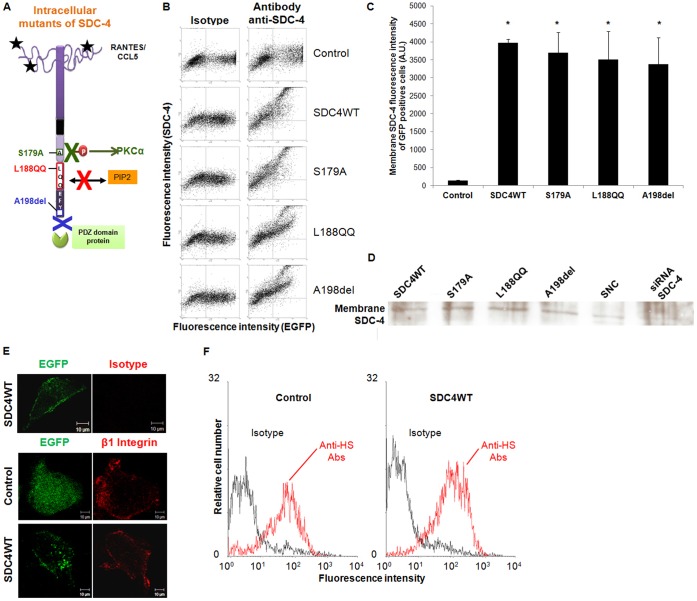
Fig. 1. Syndecan-4 mutants are located at the membrane of endothelial cells.
(A) Schemes of the syndecan-4 cytoplasmic constructs used in the study: S179A mutation expected to lead to a constitutive PKCα activation; PIP2− (Y188KK to L188QQ) mutation; PDZ− (deletion of the COOH-terminal A198 residue) mutation. (B) HUV-EC-C transfection efficiency was determined by flow cytometry on non-permeabilized cells. Transfected cells were quantified for EGFP fluorescence (horizontal axis) and for fluorescent SDC-4 staining after cell incubation with specific antibody or control isotype (vertical axis). Transfection rate from representative experiments were estimated for each plasmid. (C) Cells were transfected with GFP plasmid (control), SDC4WT-GFP (SDC4WT) or SDC-4 constructs (S179A, L188QQ or A198del) (horizontal axis). Expression of membrane SDC-4 in GFP-positive cells was quantified by flow cytometry with specific anti-SDC-4 antibodies without cell permeabilization (vertical axis). * P<0.05, versus control cells. (D) Membrane SDC-4 expression was analyzed by western blot using SDC-4 antibodies after membrane fractionation for cells transfected with SDC4WT-GFP (SDC4WT) or SDC-4 constructs (S179A, L188QQ or A198del). Specificity of SDC-4 antibodies was checked using SDC4-siRNA transfected cells (siRNA SDC-4) and siRNA negative control (SNC). (E) HUV-EC-C transfected with GFP plasmid (control) or SDC4WT-GFP (SDC4WT) were incubated with anti-β1 integrin antibodies or isotype control (red fluorescence) and analyzed under confocal microscopy (×400). Scale bars: 10 µm. The EGFP fluorescence indicates that SDC-4 is localized at the cell membrane. The immunostaining of β1 integrin was used a specific membrane cell marker. (F) Cells were transfected with GFP plasmid (control) or with SDC4WT-GFP (SDC4WT). Membrane heparan sulfate (HS) chain expression of GFP-positive cells was quantified by flow cytometry with specific anti-HS antibodies without cell permeabilization (red histogram) or with isotype control (black histogram).

