Fig. 2.
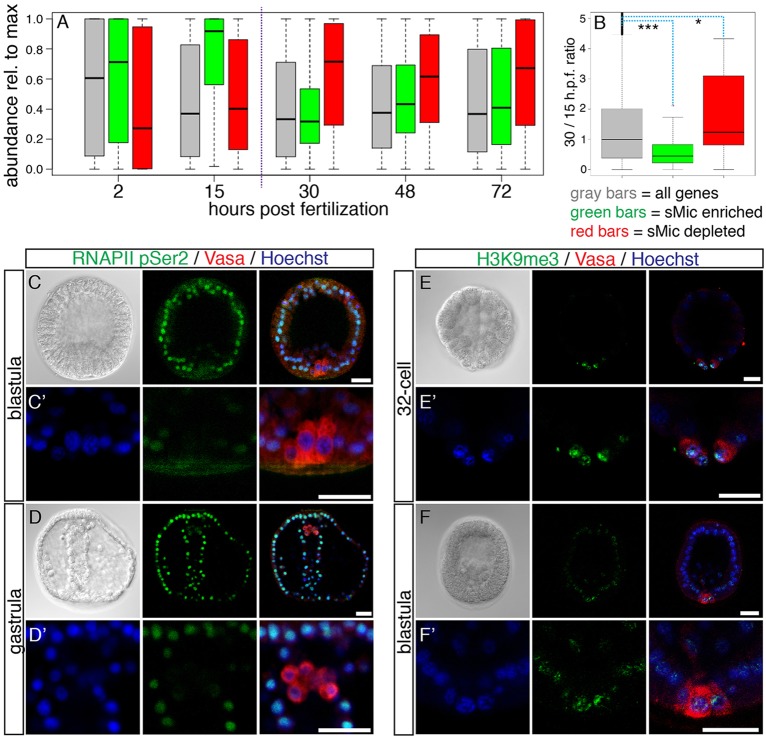
Transcriptional repression in sMics. (A) Box and whisker plots summarizing average relative abundance of sMic-enriched (green bars), sMic-depleted (red bars) and all transcripts (gray bars) in the microarray study at five developmental time points between 2 and 72 hpf. On average, sMic-enriched transcripts reach their maximum abundance before 30 hpf and then decrease. Conversely, sMic-depleted transcripts reach their maximum after 30 hpf. An average of all genes in the microarray study remains relatively constant through development. (B) Ratio of average expression levels from 15 to 30 hpf for sMic-enriched (green bars), sMic-depleted (red bars) and all transcripts (gray bars). ***P=1.076e-06, *P=0.001357 (Mann–Whitney U-test). (C-D′) Immunofluorescence signal for RNAPII pSer2 (green) is depleted in sMics of blastula (C,C′) and gastrulae (D,D′). (E-F′) H3K9me3 (green) immunofluorescence is enriched in sMics in 32-cell embryos (E,E′) and blastulae (F,F′). (C′,D′,E′,F′) Higher magnification views of the sMics, labeled with Vasa antibody (red) (Voronina et al., 2008). Scale bars: 20 µm.

