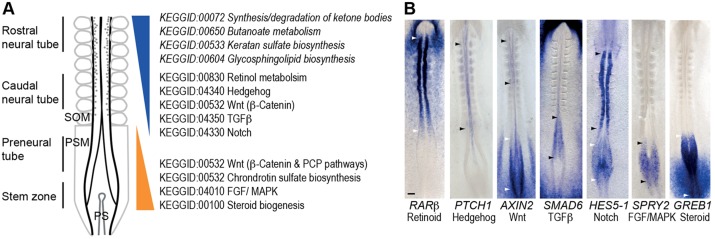
Fig. 3.

Changes in signalling activity along the elongating neural axis. (A) Changes in significantly regulated signalling pathways indicated by KEGG pathway analysis of the PNT versus the caudal neural tube CNT (additional KEGG terms identified in pooled SZ+PNT versus CNT+RNT analysis in italics). SOM, somites; PSM, presomitic mesoderm; PS, primitive streak. (B) Examples of signalling indicators for seven pathways exhibiting localised activity along the neural axis. Regions between arrowhead pairs (black or white) indicate sites of elevated signalling. Scale bar: 100 µm.
