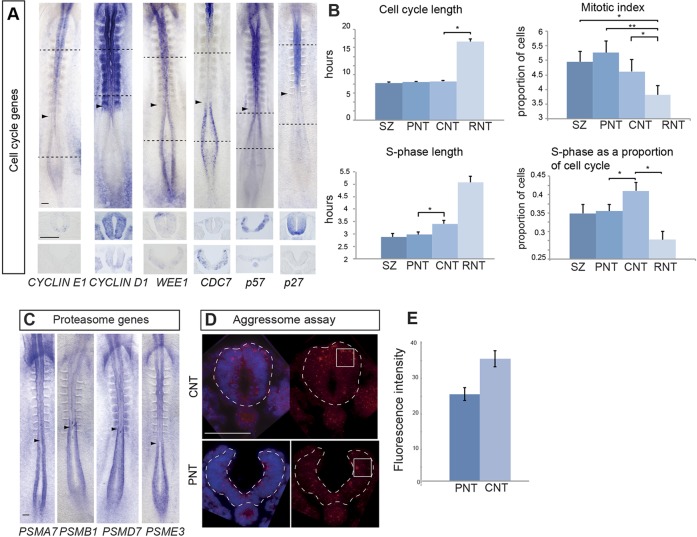
Fig. 5.
Cell cycle and epigenetic gene expression patterns, and analysis of cell cycle parameters and proteasome efficiency. (A) Whole-embryo mRNA in situ hybridisation for key cell cycle genes cyclin E1, cyclin D1, WEE1 and CDC7, and the Cdk inhibitors P57 and P27 (black dashed lines indicate the position of transverse sections beneath each embryo). (B) Histograms for cell cycle time, mitotic index, S phase duration and S phase as a proportion of cell cycle time in each of the four regions assessed along the neural axis (*P<0.05; **P<0.001). CNT, caudal neural tube; PNT, preneural tube; RNT, rostral neural tube; SZ, stem zone. Data are mean±s.e.m. (C) Whole-embryo mRNA in situ hybridisation for four genes encoding proteasome component proteins predicted by microarray to be enriched in the SZ and the PNT (indicated with arrowheads) compared with the CNT. (D) Aggresomes identified by ProteoStat labelling kit (red) in the PNT and the CNT. (E) Quantification of fluorescence intensities measured in sections of each tissue in quadrants (white outlined boxes) (n=5 embryos, at least four sections for each region) and compared using an unpaired t-test, P<0.001. Data are mean±s.e.m. Scale bars: 100 µm.

