
Fig. 1.
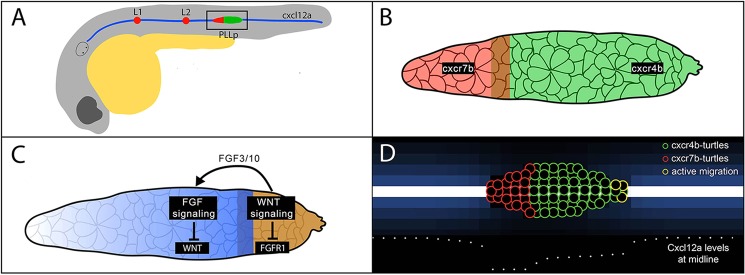
Schematic of PLLp migration, gene expression domains and example model output. (A) Schematic of PLLp migration along the myoseptum. (B) Detail of the region outlined in A, showing approximate expression domains of cxcr4b and cxcr7b. (C) Schematic of juxtaposed Wnt and FGF signaling domains in the PLLp. Arrow indicates diffusion of FGF3 and FGF10A. (D) Example of PLLp computational model. In all model figures green circles represent cxcr4b-turtles, red circles represent cxcr7b-turtles and yellow circles represent actively migrating turtles. Blue shades show levels of Cxcl12a in patches.