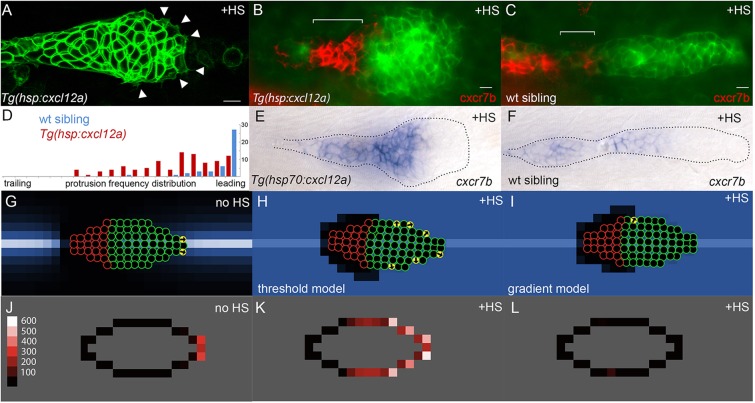
Fig. 2.
Experimental and simulated overexpression of Cxcl12a. (A) Morphology of PLLp in Tg(hsp:cxcl12a) after 1 h of heatshock (corresponding to t=78 min in supplementary material Movie 1). Arrowheads indicate protrusions. (B,C) False-color overlay of cxcr7b in situ hybridization (red) in Tg(hsp70:cxcl12a) (B) and wild-type sibling embryo (C) after heatshock for 1 h and recovery for 2 h. (D) Frequency of protrusions observed from the leading to the trailing end of the PLLp in embryos with heatshock-induced cxcl12a expression (red bars, six embryos) compared with that in control siblings (blue, six embryos). Each bar represents the frequency of protrusions observed in 5% increments of the relative distance from the leading end of the PLLp observed. (E,F) In situ hybridization for cxcr7b transcript in Tg(hsp:cxcl12a) (E) and wild-type sibling (F) PLLp after a 30 min heatshock at 37.5°C and 4 h of recovery. (G) Model PLLp without heatshock. (H) Model PLLp after heatshock when turtles are migrating in response to above-threshold levels of Cxcl12a. (I) Model PLLp after heatshock when turtles are migrating in response to the gradient of Cxcl12a. (J-L) Time-averaged position of actively migrating turtles within model PLLp for the conditions in G-I, respectively. Scale (‘protrusions’/1000 model iterations) is in J. Scale bars: 10 µm.

